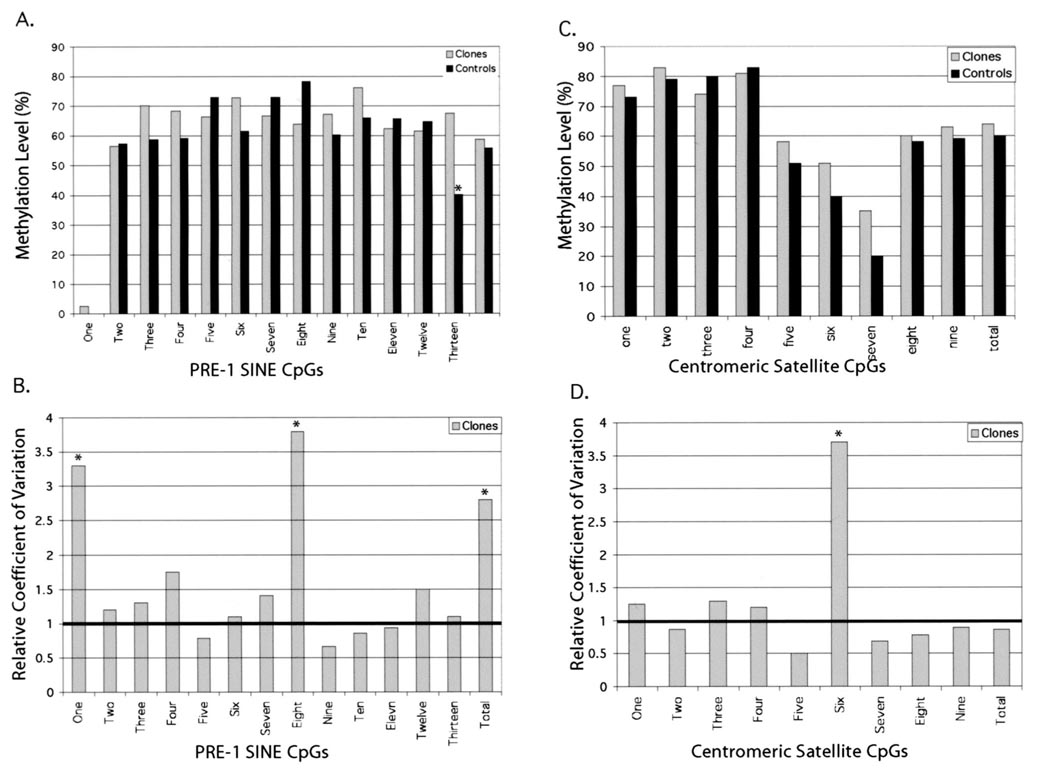
FIG. 4.
CpG methylation in PRE-1 SINE and centromeric satellite regions in cloned and control pigs. A) Percent methylation of each of the 13 conserved CpGs in the selected PRE-1 SINE region. B) Relative variation in methylation at each of the conserved CpGs. Column values with an asterisk are significantly different from controls at P < 0.05. C) Percent methylation at nine conserved CpGs in the selected region of the centromeric satellite region. D) Relative methylation variation in the centromeric satellite region.

