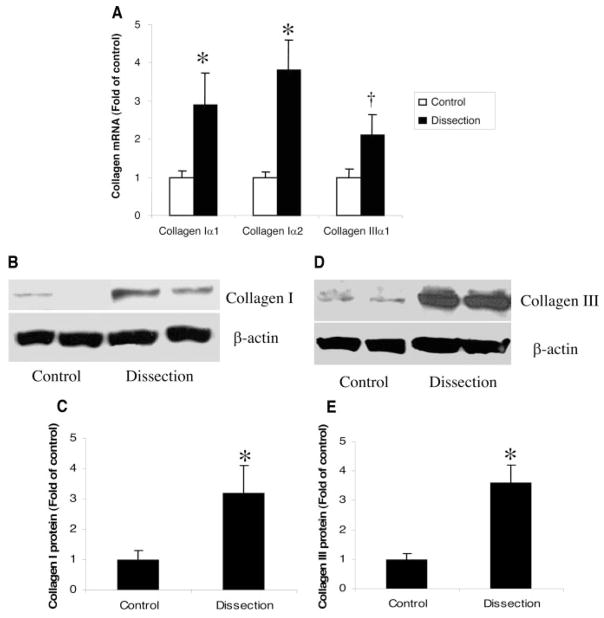
Figure 1.
Expression of collagen in patients with TAD and controls. When compared with controls, TAD patients showed increased levels of collagen types Iα, Iα2, and IIIα1 mRNA by quantitative real-time RT-PCR (A). Similarly, on Western blots, patients with TAD showed significantly increased levels of type I (B, C) and type III (D, E) collagens. Densitometric measurement was performed to quantify the relative expression of collagens after Western blotting with the use of imaging densitometry and AlphaEaseFC software (C, E). Results shown represent mean±SEM of 10 samples. *P<0.05, †P=0.09 by Student t test.

