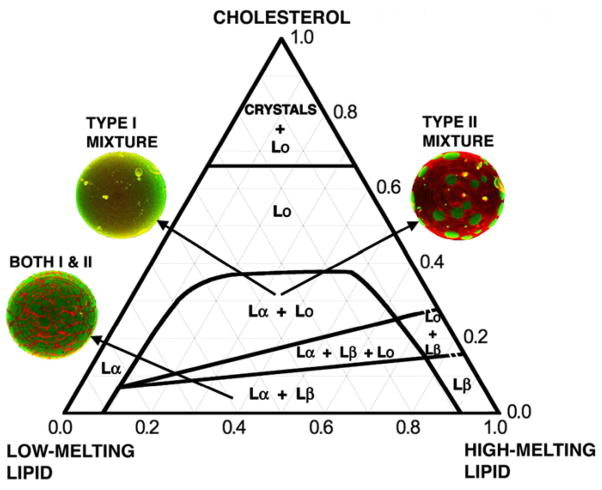
Fig. 1.
Compositional phase diagrams of 3-component bilayer mixtures that contain cholesterol together with a high-melting point lipid and a low-melting point lipid are useful models for animal cell plasma membrane outer leaflets. To date, the various mixtures of these types all seem to display the same pattern of phases. The most important distinction among such 3-component mixtures is the behavior designated here as Type I or Type II. The Type I mixtures have nanoscopic domain dimensions for the coexistence regions {Lα+Lo} and {Lα+Lβ+Lo}. Fluorescence microscope images giant unilamellar vesicles, GUVs, of the Type II mixtures reveal visible domains, whereas Type I mixtures appear uniform in these phase regions. The exact positions of the phase boundaries depend upon the particular lipids. Dashed lines for boundaries involving the solid Lβ phase indicate uncertainty as to whether the phase transition is first-order or higher order (continuous). Some lipids form the untilted solid Lβ phase as shown, others are in the solid tilted Lβ′ phase, and make a transition (not shown) to the Lβ phase. Although large regions of the composition space are found to have a single phase of Lα or Lo, these single phases might have local structure, as yet uncharacterized.

