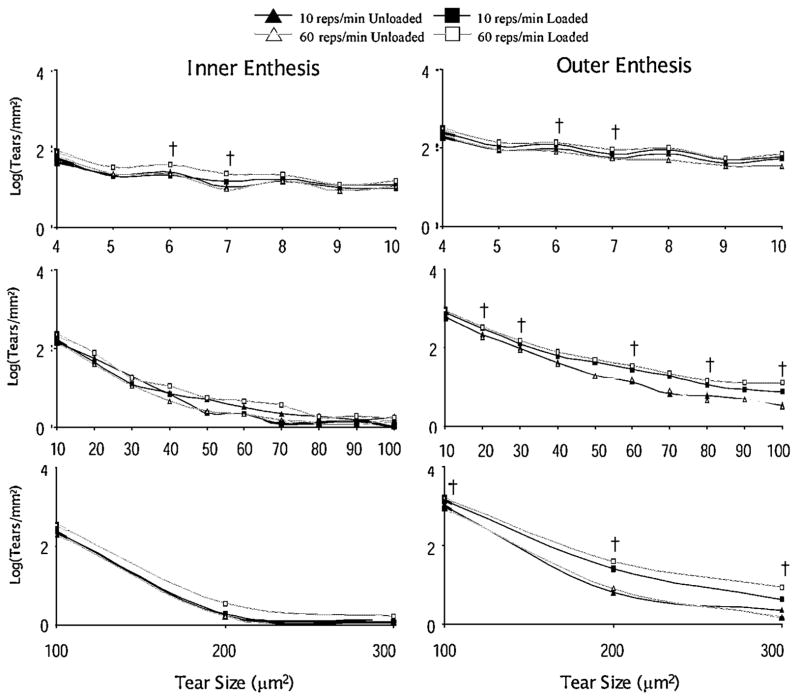
Figure 5.
The log of the distribution of microtears by tear size for the inner and outer regions of the tendon at the enthesis for both loading groups. No significant differences were found in the 10 reps/min group (paired t-test, p <0.01). The symbol † indicates a significant difference between unloaded and loaded limbs (paired t-test, p <0.01) in the 60 reps/min group, n =9.

