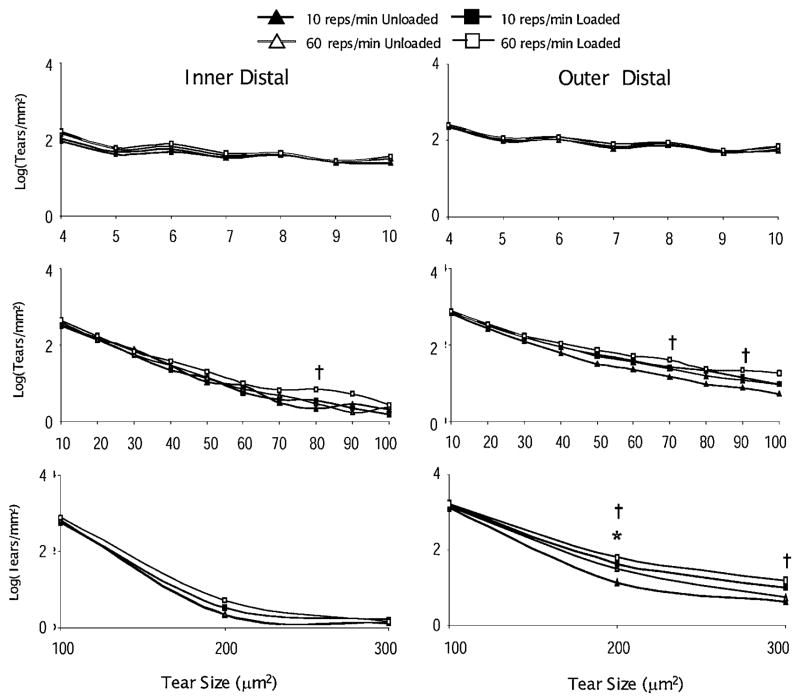
Figure 6.
The log of the distribution of microtears by size for the inner and outer parts of the tendon distal to the enthesis for both loading groups. The symbols † and * indicate significant differences between unloaded and loaded limbs (paired t-test, p <0.01) in the 60 (n =9) and 10 (n =8) reps/min group, respectively.

