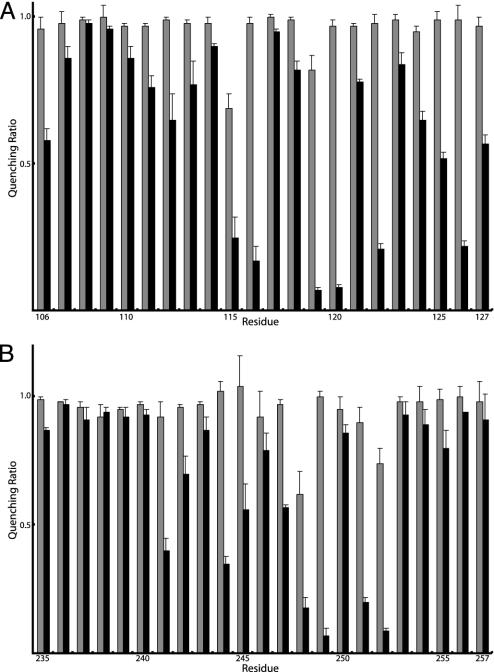
Fig. 2.
NEM and Ag+ sensitivity of residues in aTMH2 and aTMH5. Membranes were treated as described in the Fig. 1 legend. The results are presented as the ratios of quenching in the presence of Ag+ or NEM to the quenching in the absence of either reagent. The gray bars represent the quenching ratio ± NEM treatment, and the black bars represent the quenching ratio ± Ag+ treatment. Each bar represents the average ratio from n ≥ 2 determinations ± SD. In nine trials of control membranes lacking Cys, quenching ratios of 0.96 ± 0.06 for NEM and 0.90 ± 0.04 for Ag+ were observed relative to the untreated control.

