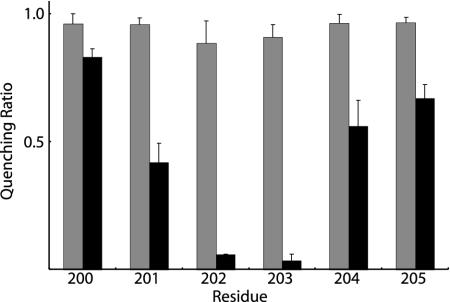
Fig. 4.
NEM and Ag+ sensitivity of residues at the cytoplasmic end of aTMH4. Membranes were treated as described in the legend to Fig. 1. The results are presented as the ratios of quenching in the presence of NEM or Ag+ to the quenching in the absence of either reagent. The gray bars represent the quenching ratio ± NEM treatment, and the black bars represent the quenching ratio ± Ag+ treatment. Each bar represents the average ratio from n = 3 determinations ± SD.

