Fig. 6.
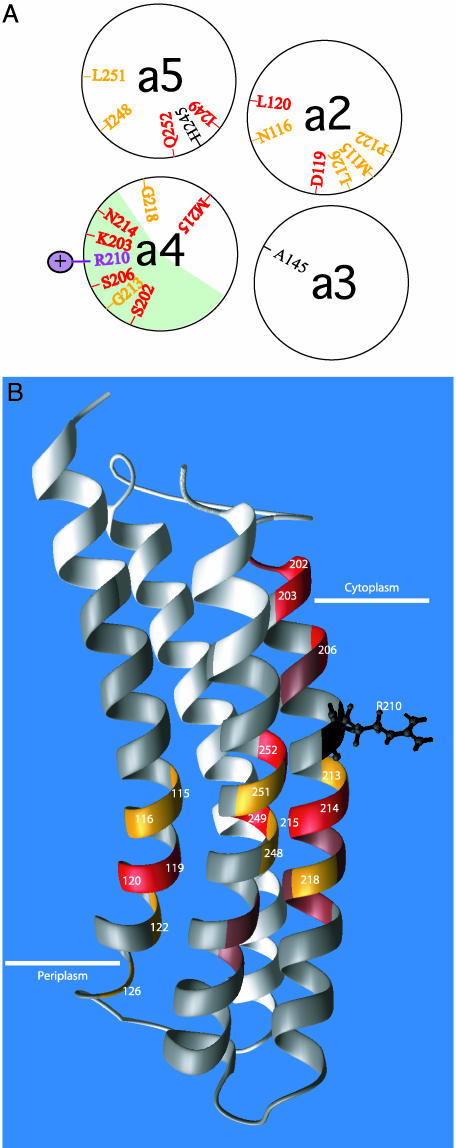
Two distinct regions of Ag+ sensitivity in subunit a.(A) Cross-sectional view of TMH2–5 of subunit a depicted as α-helical wheels. The most Ag+-sensitive residues are shown in red (>90% inhibition) and orange (76–90% inhibition). The position of the aArg-210 side chain is also indicated. The light green area on aTMH4 represents the helical face that crosslinks to TMH2 of subunit c.(B) Placement of Ag+-sensitive residues in 3D model of subunit a by Rastogi and Girvin (25) (Protein Data Bank entry 1C17). Ag+-sensitive residues are indicated as described in Fig. 5, i.e., red (>90% inhibition), orange (76–90% inhibition), and brown (50–75% inhibition). Insensitive residues are shown in gray, and untested residues are white.

