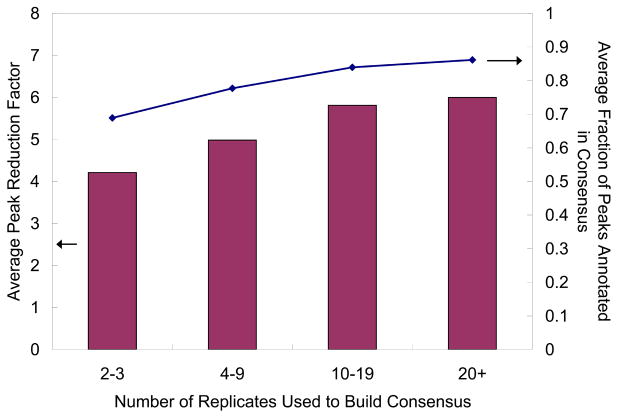
Figure 3.
Reduction of noise after consensus creation, by the number of replicates used. The average peak reduction factor (bars, left axis) is the average, over all library entries in that bin, of the peak reduction factor, which is defined as the average number of peaks in the replicate spectra divided by that in the consensus spectrum. The average fraction of peaks annotated in consensus (line, right axis) is the average, over all library entries in that bin, of the fraction of peaks that are annotated in the consensus spectrum. Note also that the average fraction of annotated peaks in the raw replicate spectra is about 42% (not shown in the figure).

