Figure 1.
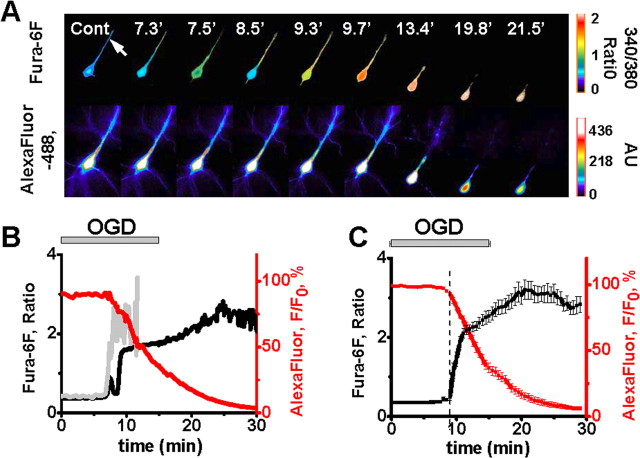
OGD induces Ca2+ deregulation followed by loss of membrane integrity in CA1 neurons. A, Fluorescence images of an individual CA1 neuron coloaded via a patch pipette with a ratiometric Ca2+-sensitive indicator (top panels; 340/380 nm fura-6F ratio images) and an ion-insensitive fluorescent marker (bottom panels; AlexaFluor-488 fluorescence). Arrow indicates the location of the dendritic measurements, and numbers indicate time (in minutes) following onset of OGD. B, Traces show somatic fura-6F ratio (black) and AlexaFluor-488 (red) fluorescence changes in the same neuron illustrated in A. The gray trace shows the fura-6F changes in the dendrite. C, Traces show mean fluorescence changes (±SEM) from the somata of 10 CA1 neurons (black: fura-6F ratio, red: AlexaFluor-488). Individual responses have been aligned to the onset of an irrecoverable fura-6F ratio increases (“Ca2+ deregulation”) in each neuron (dashed line, 9.0 ± 0.34 min). The OGD bar shows the time of OGD exposure (±SEM). Note the abrupt acceleration in the loss of AlexaFluor-488 fluorescence, indicative of a terminal loss of membrane integrity, starting close to the time of Ca2+ deregulation.

