
Figure 6.
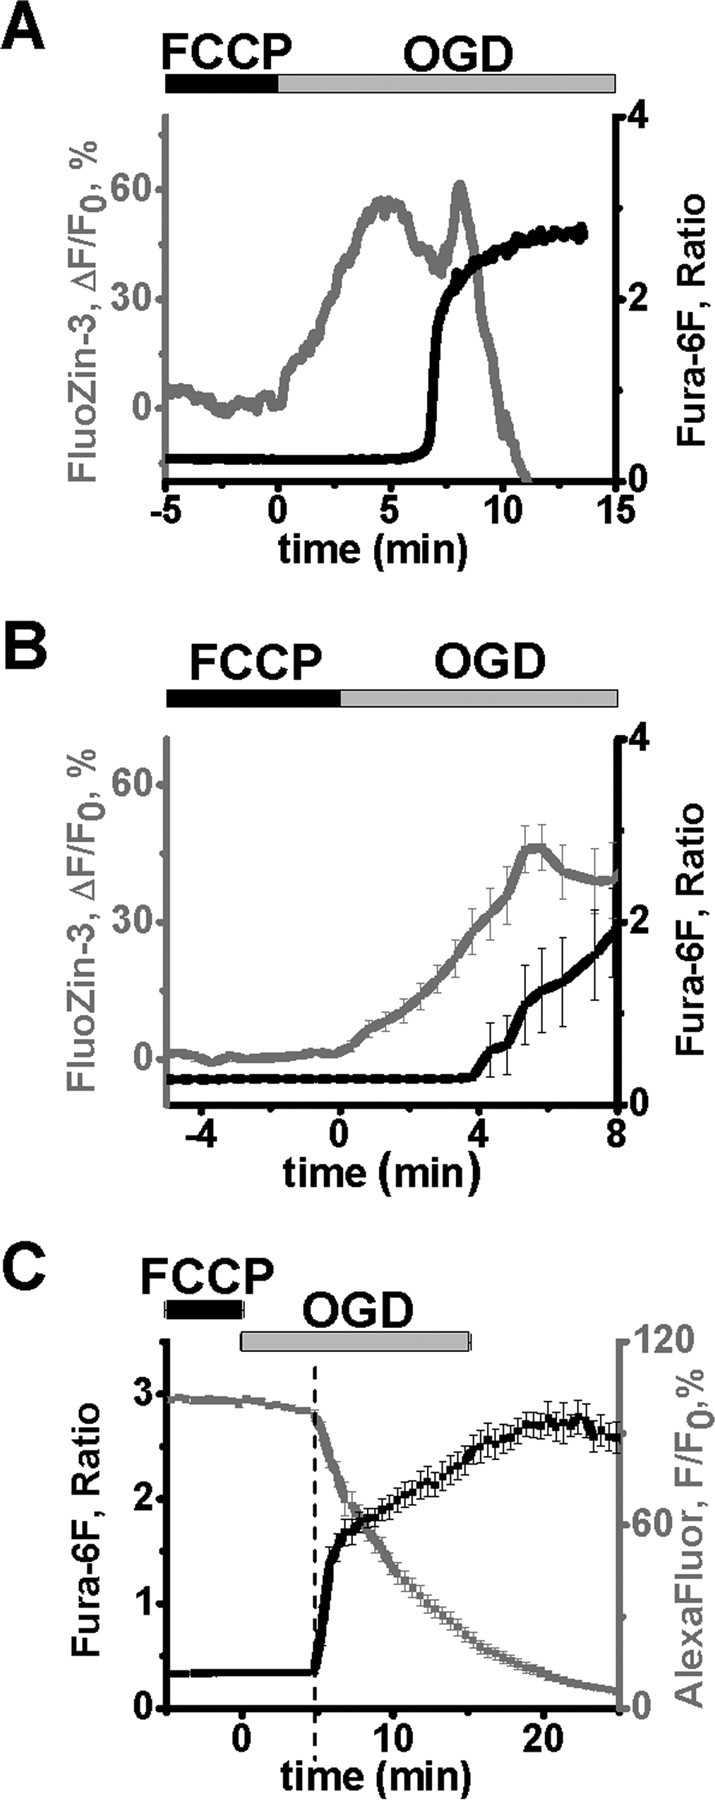
Partial mitochondrial uncoupling results in accelerated OGD-induced Zn2+ rises and Ca2+ deregulation. Neurons were loaded as indicated and exposed to FCCP (5 μm) for 5 min, followed by 15 min OGD. A, Traces from a representative neuron show that both the initial Zn2+ rise (gray) and the Ca2+ deregulation (black) were substantially accelerated, with the Zn2+ rise beginning within the first minute of OGD. B, Average traces (±SEM) from 10 CA1 neurons show the Zn2+ rise (gray; at 0.79 ± 0.50 min) and the Ca2+ deregulation (black, 5.3 ± 0.38 min). Data are aligned to the OGD onset to show the start of early [Zn2+]I rise. C, The accelerated OGD-induced Ca2+ deregulation after FCCP exposure is still linked to a membrane permeability increase. CA1 neurons were loaded with fura-6F and AlexaFluor-488, and exposed to FCCP before 15 min OGD as above. Traces (±SEM) are aligned to the start of the Ca2+ deregulation (4.9 ± 0.29 min, n = 10 cells).