
Figure 7.
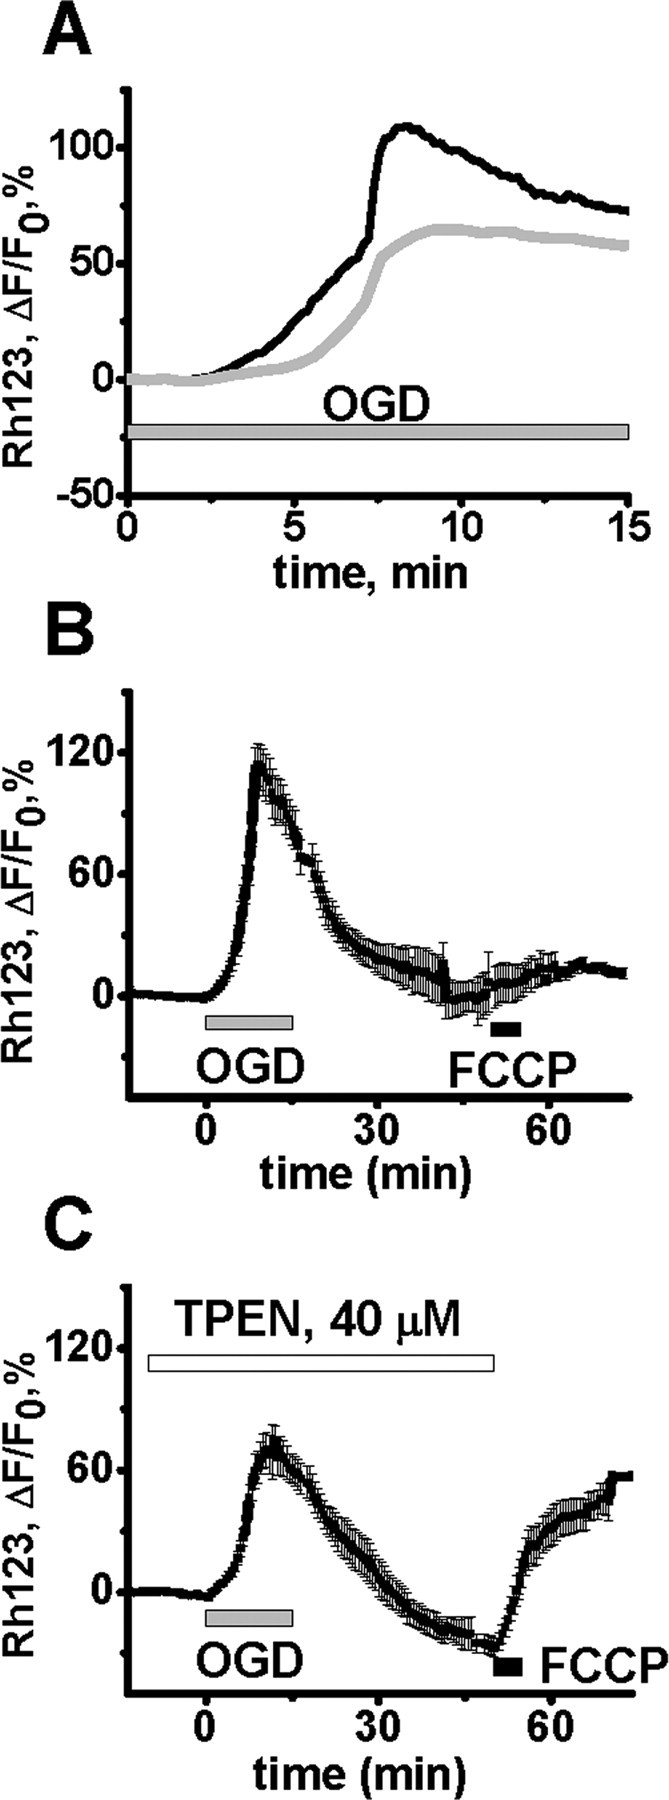
Zn2+ contributes to mitochondrial depolarization during OGD. Slices were bath loaded with the mitochondrial potential (ΔΨm)-sensitive indicator Rhodamine 123 (Rh123), and subjected to 15 min of OGD in the absence or presence of TPEN (40 μm). A, Trace shows representative OGD-induced Rh123 fluorescence changes in the CA1 pyramidal cell layer of a control slice (black), and one in which TPEN was present (gray). An increase in fluorescence indicates loss of ΔΨm. B, OGD induces a long lasting loss of ΔΨm. After 15 min OGD, slices were allowed to recover for 35 min before exposure to 5 μm FCCP, to directly induce loss of ΔΨm (peak ΔF/F0 during OGD, 107 ± 7.35%; peak increase after FCCP, 14.1 ± 4.7%, n = 6). C, TPEN improves recovery of ΔΨm after OGD. Slices were subjected to 15 min OGD as above but in the additional presence of TPEN, and 35 min later exposed to FCCP. The presence of TPEN resulted in a decreased peak ΔF/F0 during OGD (73 ± 6.96%, p < 0.01 vs no TPEN), and an increased response to FCCP (65.9 ± 7.2%, p < 0.01 vs no TPEN, n = 7), indicating a substantial recovery of ΔΨm after OGD. In B and C, traces show mean values ± SEM.