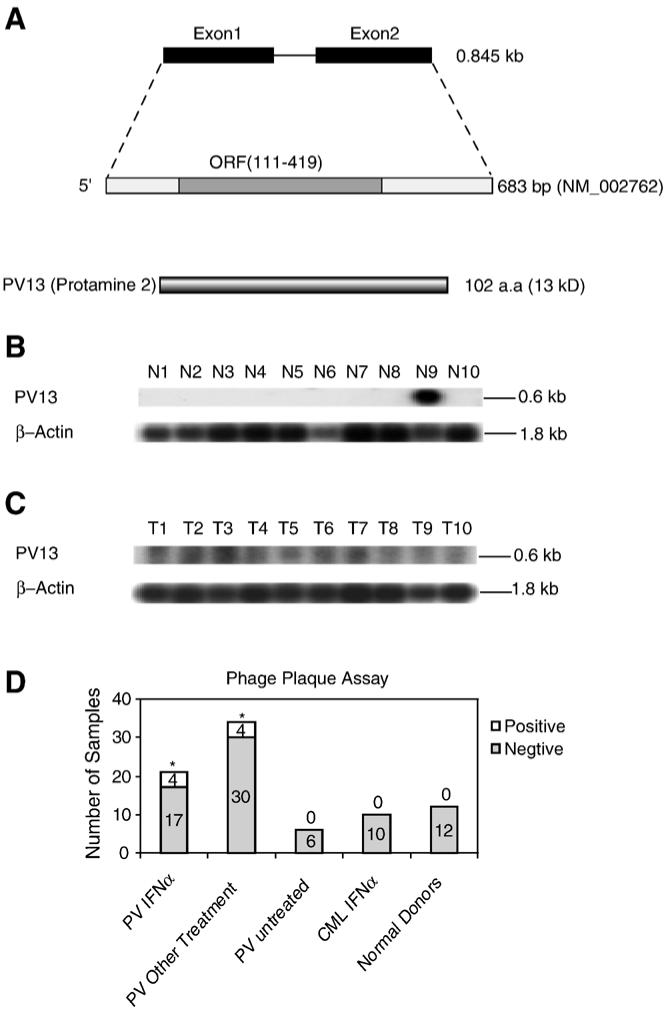
Figure 2.

The novel tumor antigen PV13 (protamine 2). (A) Schematic representation of the genomic structure, mRNA, and protein structure of tumor antigen PV13 (protamine 2, GenBank accession number: NM_002762). (B) The expression of PV13 transcripts in normal tissues detected by Northern blot. The lanes N1 to N10 indicate various normal tissues in the order of brain (N1), liver (N2), placenta (N3), small intestine (N4), colon (N5), thymus (N6), spleen (N7), prostate (N8), testis (N9), and ovary (N10), respectively. The hybridization analyses of the normal tissue and tumor cell expression (BD Clontech) with 32P-labelled specific probes, as indicated, were performed, respectively. The transcript sizes are indicated with kilobases (kb). (C) The expression of PV13 transcripts in tumor cells detected by Northern blot. The lanes T1 to T10 indicate various tumor cells in the order of acute T cell leukemia (Jurkat cells) (T1), Burkitt’s lymphoma (CA46) (T2), breast cancer (MDA-MD-453) (T3), Burkitt’s lymphoma (Namalwa) (T4), epidermal carcinoma (A-431) (T5), uterine carcinoma (MES-SA) (T6), Burkitt’s lymphoma (Raji) (T7), osteosarcoma (MG-63) (T8), histiocytic lymphoma (U-937) (T9), and cervical adenocarcinoma (Hela S3) (T10), respectively. (D) The IgG antibody reactions to the tumor antigen PV13 detected by phage plaque assay. The detection rates in each group are presented with the empty column as the positive (on the top) and the solid column as the negative (on the bottom). The experiments were repeated for three times. The representative results are shown. The groups whose detection rates of the IgG antibody reactions to PV13 are statistically higher than that of healthy donors (the Chi-Square Goodness-of-Fit Test; p < 0.05) are marked with *.
