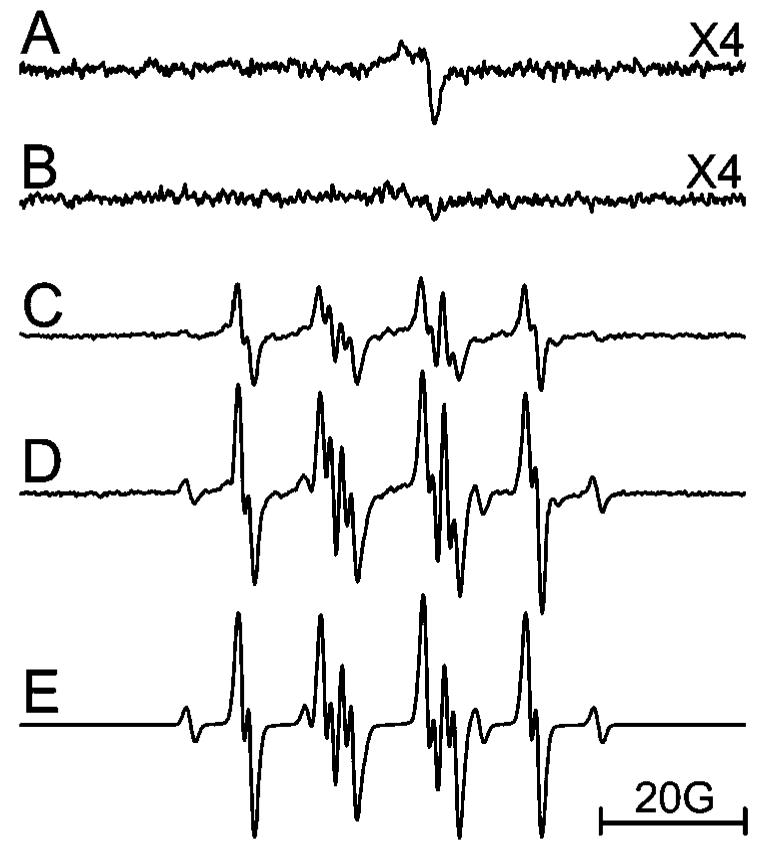
Figure 6.
EPR spectrum of an aqueous solution of C60(OH)24 (50 μM) containing 1% DMSO. (A) Irradiated (λ > 300 nm); (B) irradiated (λ > 300 nm) in the presence of 5 mM NADH; (C) irradiated (λ > 400 nm) in the presence of 80 mM DMPO; (D) same as part C with the addition of 5 mM NADH; and (E) simulation of part D using the following parameters: DMPO/O2·- (aN = 14.1 G, aH1 = 11.3 G, and aH2 = 1.2 G; 92.9%); DMPO/C· (aN = 16.3 G and aH = 23.4 G; 7.1%). Instrumental settings: microwave power, 10 mW; modulation frequency, 100 kHz; modulation amplitude, 1 G; time constant, 655 ms; 335 s scan time; and scan range, 100 G.

