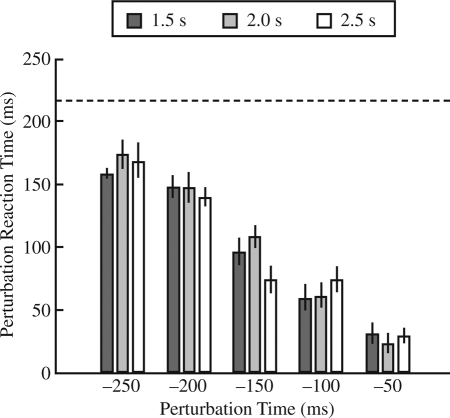
FIGURE 3.
Perturbation reaction time (in ms) for trials with false starts as a function of perturbation time (relative to the auditory stimulus) for all three foreperiod durations. The dashed line shows the mean reaction time across all conditions for the trials in which there were no false starts. Error bars indicate one standard error of the mean.

