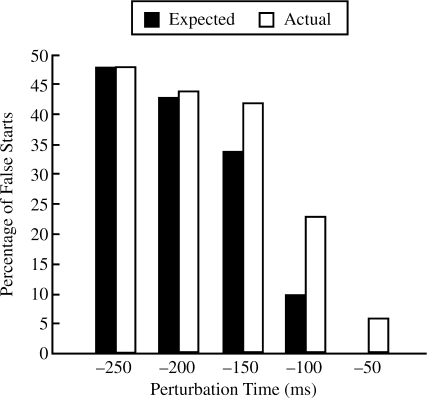
FIGURE 4.
Percentage of false starts expected, given the distribution of perturbation response times in the −250-ms condition and the actual percentage of false starts as a function of perturbation time. At all perturbation times other than −250 ms, the actual percentage of false starts exceeded the expected percentage.

