Abstract
The effect of high-frequency oscillatory ventilation (HFOV) settings on the distribution of lung volume (VL) with changes in mean airway pressure (Paw), frequency (fR) and tidal volume (VT) remains controversial. We used computer tomographic (CT) imaging to quantify the distribution of VL during HFOV compared to static continuous positive airway pressure (CPAP). In anesthetized, supine canines, CT imaging of the entire lung was performed during CPAP and HFOV at Paw of 5, 12.5 and 20 cmH2O, fR = 5, 10, 15 Hz. We found small, statistically significant decreases compared with CPAP in total and regional VL during HFOV that were greatest at lower fR and Paw. Apex and base sub-volumes underwent changes comparable to the lung overall. Increases in fR were accompanied by increases in PaO2. These finding provide additional insight into the impact of HFOV settings on the distribution of VL and suggest that there is low risk of occult regional over-distention during HFOV in normal lungs.
Keywords: large-animal models, canine, computer tomography, dynamic hyperinflation
1. Introduction
High-frequency oscillatory ventilation (HFOV) is an unconventional form of mechanical ventilation that uses very small tidal volumes (VT) at respiratory rates (fR) between 3 and 20 cycles/second (Hz), allowing effective gas exchange while maintaining the lung at a relatively constant volume. Since distal airway pressure oscillates a small amount about a controlled elevated mean pressure, HFOV is thought to have potential to protect the lung from the end-inspiratory overdistension and end-expiratory derecruitment implicated in ventilator-associated lung injury (Fessler et al. 2005). HFOV has been used extensively for the care of neonates with surfactant deficiency and respiratory distress syndrome, and more recently has been explored for adults with acute lung injury (Froese et al. 2005).
During conventional ventilation, total and regional lung volume is proportional to the mean airway pressure, and the distribution of tidal volume is determined by the distribution of compliance. During HFOV, however, this may not be true because of factors related to the high instantaneous flows and oscillatory frequencies (fR). Studies in animal and humans have demonstrated that under certain conditions mean alveolar pressure may increase during HFOV despite constant proximal mean airway pressure (Paw) (Saari et al. 1984; Simon et al. 1984; Bryan et al. 1986), an effect attributed to asymmetry between inspiratory and expiratory resistance and/or expiratory flow limitation (Simon et al. 1984; Solway et al. 1986; Cha et al. 1988). Furthermore, as fR and inspiratory flow rates increase, properties of the central airways (resistance, inertance) and fluidic phenomena (branch angles, flow separation) become increasingly important (Otis et al. 1956; Tsuda et al. 1990a; Tsuda et al. 1990b) and can alter the regional distribution of tidal volume (VT) or mean lung volume (VL) (Allen et al. 1985a; Allen et al. 1985b; Allen et al. 1987; Venegas et al. 1994). Therefore, although Paw may be maintained at a prescribed level, the possibility exists that occult regional overdistension or gas trapping may occur. This concern is of particular importance with the application of HFOV in adults, who may be more prone to gas trapping because of underlying lung or airways disease.
Advances in X-ray computed tomographic (CT) imaging over the past decade have produced scanners that can image the entire lung at high resolution in 5 to 8 seconds. CT provides a quantitative measurement of both lung volume and regional lung density, which is very sensitive to small changes in parenchymal air volume (Simon 2005). Furthermore, since several cycles of HFOV occur during CT image acquisition and lung motion is small because of the small VT, CT images obtained during continuous HFOV provide a measurement of regional mean lung volume and density in the steady-state (Luecke et al. 2005). With rapid CT imaging of the whole lung, regional differences in the distribution of air volume and mechanical heterogeneity can be quantified (Simon 2005). To explore the effect of HFOV fR, VT, and Paw on the distribution of lung volume and air content, we designed a study utilizing high-resolution CT imaging in healthy, supine, anesthetized canines.
2. Methods
2.1 Animal preparation and experimental protocol
All experimental procedures were approved by the Johns Hopkins University Animal Care and Use Committee and adhere to the American Physiological Society’s Guiding Principles in the Care and Use of Animals. Five mongrel dogs (18.3 ± 4.6 kg) were anesthetized (pentobarbital 25 mg/kg i.v. initially and 10 mg/kg i.v. hourly) and orally intubated with an 8.0 mm cuffed endotracheal tube. Muscle relaxation was provided with pancuronium (0.1 mg/kg i.v. initial and 0.05 mg/kg i.v. as needed). A percutaneous femoral arterial catheter was placed under sterile conditions for arterial blood pressure (Part) monitoring and blood gas sampling. Initial mechanical conventional ventilator (CV) settings were established using a piston ventilator (PLV 102, Respironics, USA), inspired oxygen fraction (FiO2) of 0.21, positive end-expiratory pressure (PEEP) of 5 cm H2O, tidal volume (VT) of 15 ml/kg, and respiratory rate started at 20 breaths per minute and adjusted to eucapnia. Airway opening pressure (Paw), and end-tidal partial pressure of carbon dioxide (PETCO2), oxygen saturation (SpO2), and Part, were recorded on a Gould chart recorder. Arterial blood gas measurements were made on a Chiron 855 Blood Gas Analyzer (Chiron Inc., Emeryville, CA) during CV and after 15 min of HFO ventilation for determination of eucapnic HFOV settings. No CV was performed during the imaging portion of the experiment.
2.2 High-frequency ventilation
Following CV blood gas analysis, the subject was then transitioned to HFOV using a specially designed piston oscillator that permits accurate control of delivered VT as well as closed-loop control of Paw as previously described (Simon et al. 1991), with a mass flow controller (Model 840, Sierra Instruments, Monterey, CA) used to regulate the bias flow outflow for control of Paw. Unlike clinically used oscillators, our research HFOV design permits a controlled volume displacement of the piston head that is calibrated to the delivered VT. Therefore, VT is set, and delta P in our HFOV system is simply a measurement rather than a set ventilator parameter. Paw was measured from the lateral pressure of a flush side hole at the center of a long, straight delivery tube such as to minimize flow-dependent artifact (Simon et al. 1984; Simon et al. 1991). The room air (FIO2 of 0.21) bias flow was set at 8 L/min and I:E ratio was 1:1 with a sinusoidal waveform throughout the study. HFOV VTs for eucapnic ventilation were determined based on ABG analysis for each combination of frequency (fR = 5, 10, and 15 Hz) and Paw (5, 12.5, and 20 cmH2O). Once these baseline ventilatory settings were determined, the anesthetized animal was transported to the CT suite for imaging as detailed below. At the conclusion of the study, animals were transferred back to CV and weaned to spontaneous ventilation. After emergence from anesthesia, all intravascular catheters were removed and the animals observed until fully recovered.
2.3 CT imaging and analysis
CT imaging was performed on a Toshiba Aquilion 16 multi-detector CT scanner software version V1.30ER000. CT scanning was performed in axial mode at 100 kVp, 100 mAS, and 500 milliseconds exposure time. Contiguous 2mm slices (4 slices per gantry rotation) were obtained through the entire lung from apex to base during continuous positive airway pressure (CPAP) breathholds and during steady-state HFOV at the same Paw (Paw= 5, 12.5, and 20 cmH2O). Subjects were randomized to receive their Paw and fR settings in a different order to minimize volume history. HFOV was performed at fR =5, 10, and 15 Hz, using VT set 20% above and 20% below the eucapnic VT (determined earlier at each fR and Paw), with imaging following a recruitment maneuver and 5 minutes of equilibration at the new HFOV setting. The recruitment maneuver consisting of two sustained inflations to 20 cmH2O for 30 seconds and was performed prior to each imaging run while on HFOV. Once on HFOV, no additional periods of CV were performed until completion of the CT imaging. Fig. 1 illustrates the high quality of the lung images obtained during HFOV compared to CPAP at the same Paw. Entire lung volume image sets were obtained for each condition, resulting in 105 image sets.
Figure 1.
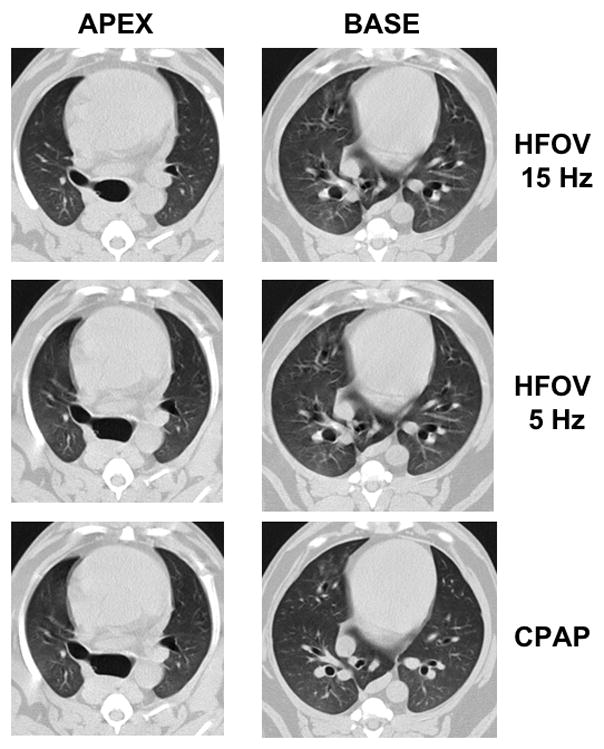
Representative CT images from a typical subject during HFOV and CPAP at Paw 5 cmH2O. Anatomically matched lowermost apex slice and uppermost base sub-volume slices are presented. Distinctive anatomic landmarks are easily identified between conditions. Note the lack of lung motion artifact even during HFOV at 5 Hz compared to the heart border.
CT images were analyzed to examine changes in 1) whole lung air and tissue volumes, 2) regional air volumes at the apex and base, and 3) axial distribution of regional air volume and density, 4) vertical gradients of lung density. Image analysis was performed using the Pulmonary Analysis Software Suite (PASS), developed at the University of Iowa - Division of Physiologic Imaging (Hoffman et al. 2003). Images were first segmented to separate lung tissue from surrounding structures, using the semi-automated routines in PASS, and then manually adjusted to correct for errors including left and right lung identification, proximal airway exclusion, and to refine the cardiac border. Whole and regional lung air and tissue volumes, in which “tissue” includes lumped blood, parenchyma, airways, and vessels all with density approximating that of water, were calculated from the measured density of air (within trachea) and tissue (within heart) in the images (Simon 2000). The calibrated densities for each pixel were then measured and the relative air and tissue volumes calculated for all regions of interest within the segmented lung fields. Regional APEX and BASE sub- volumes were defined by matching distinctive anatomic landmarks in the apex and base found in all image sets for a given animal and then including all the slices from that point to the most cranial (for APEX) or caudal (for BASE) extent of the lung in the sub-volume (Fig. 2).
Figure 2.
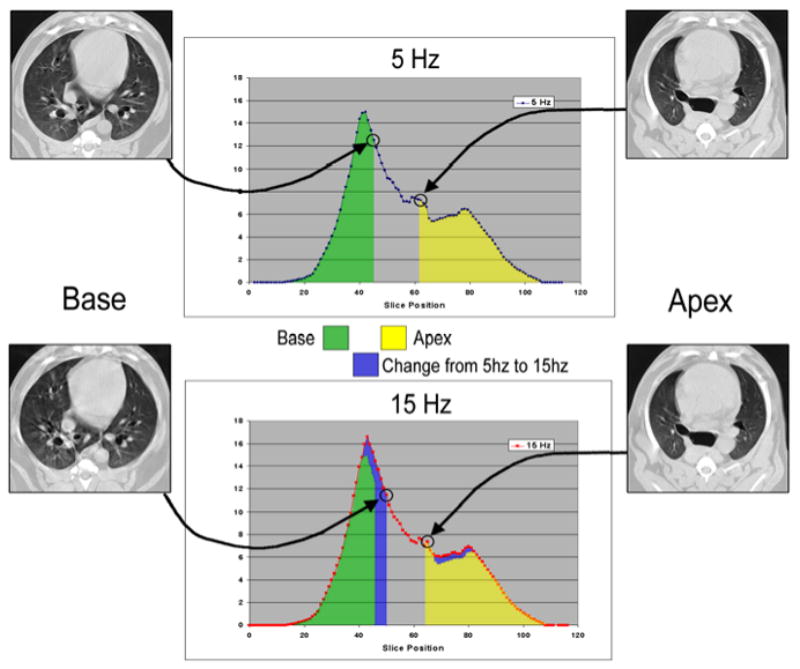
Illustration of slice selection based on anatomic detail to define limits of base and apex sub-volumes. The location of the matched slices along the axial volume profile, colored to illustrate the difference in volume distribution between 5 and 15 Hz, are shown with arrows. Note that the matching lung regions determined by detailed image features do not align at the same table positions, necessitating this anatomic matching approach. Yellow and green shaded areas indicate apex and base regional air volume at 5 Hz, blue shading indicates increased volume at 15 Hz compared to 5 Hz.
2.4 Statistical Analysis
Results are expressed as mean and standard deviation where appropriate. Differences between measured volumes were determined using Student’s paired t-test with a significance level at p<0.05.
3. Results
Baseline information regarding subject weights, VT during eucapnic CV and HFOV, and CT measured total air volume (Vair) during CPAP at each Paw are provided in Table 1. Blood gas data are provided in Fig. 3 and demonstrate a significant increase in PaO2 with increasing frequency during HFOV (p=0.01, 5 to 15 Hz). This trend in PaO2 was greater at the lower Paw than at Paw 20. This modest frequency dependent increase in PaO2 is similar to that seen in other animal studies of HFOV (Kamitsuka et al. 1990). PaCO2 did not change during the course of the experiment, and our eucapnic HFOV VT settings were similar to previously published reports (Venegas et al. 1993).
TABLE 1.
Subject weight, tidal and lung volumes
| Subject: | 1 | 2 | 3 | 4 | 5 | Totals mean ± SD |
|---|---|---|---|---|---|---|
| Weight: (kg) | 13 | 15.5 | 23 | 15 | 25 | 18.3 ± 4.6 |
| Conventional Vt: mL (mL/kg) | 210 (16.1) | 230 14.8) | 349 (15.2) | 225 (15) | 390 (15.6) | 281 ± 71 (15.3±0.5) |
| 5Hz Vt: mL (mL/kg) | 72 (5.5) | 75 (4.8) | 90 (3.9) | 81 (5.4) | 74 (3.0) | 78 ± 7 (4.5 ± 1.1) |
| 10Hz Vt: mL (mL/kg) | 47 (3.6) | 70 (4.5) | 63 (2.7) | 65 (4.3) | 64 (2.6) | 62 ± 9 (3.5± 0.9) |
| 15 Hz Vt: mL (mL/kg) | 35 (2.7) | 58 (3.7) | 49 (2.1) | 50 (3.3) | 54 (2.2) | 49 ± 9 (2.8 ± 0.7) |
| VA @ CPAP 5cmH2O mL (mL/kg) | 537 (41) | 371 (25) | 1215 (53) | 482 (32) | 1244 (54) | 770 ± 424 (41±12.8) |
| VA @ CPAP 12.5cmH2O mL (mL/kg) | 780 (60) | 605 (39) | 1679 (73) | 795 (53) | 1975 (79) | 1345 ± 666 (60.8 ±15.9) |
| VA @ CPAP 20cmH2O mL (mL/kg) | 1066 (82) | 791 (51) | 2162 (94) | 945 (63) | 2325 (93) | 1592 ± 725 (76.6 ±18.9) |
Figure 3.
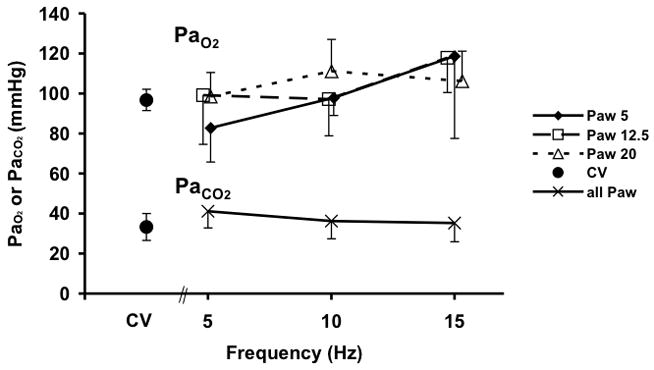
PaO2 and PaCO2 during conventional (CV) and high-frequency oscillatory ventilation (HFOV). There were no differences in PaCO2 with Paw so data were combined for clarity.
Measured total VL during CPAP increased significantly with Paw from 5 to 20 cmH2O due to increasing Vair of the lung, as expected (Fig. 4). Tissue volume (Vtissue) remained constant and thus could serve as a control to confirm the mapping of regional lung sub-volumes across image sets within an animal. There were no differences between Vair for the VT 20% above vs. 20% below eucapnic VT under any conditions, so data were combined for further analysis. Vair during HFOV, normalized to the Vair during CPAP at the same Paw, fell significantly at 5 Hz for Paw 5 and 12.5 cm H2O and at 10 Hz for Paw 12.5 cmH2O (Fig. 5). At the highest Paw of 20 cmH2O, Vair did not change with oscillatory fR compared to CPAP (Fig. 5)
Figure 4.
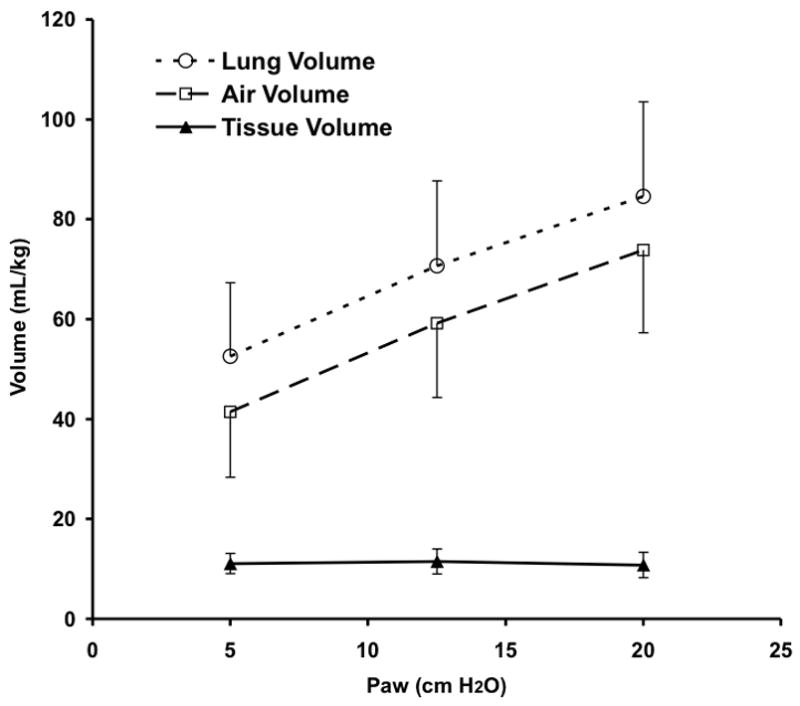
CT determined pressure-volume curve showing lung total, air, and tissue volumes during CPAP. The lung tissue was segmented from chest wall and mediastinal structures and partitioned into air and “tissue” components based on density (see text for details). Mean±SD for 5 animals.
Figure 5.
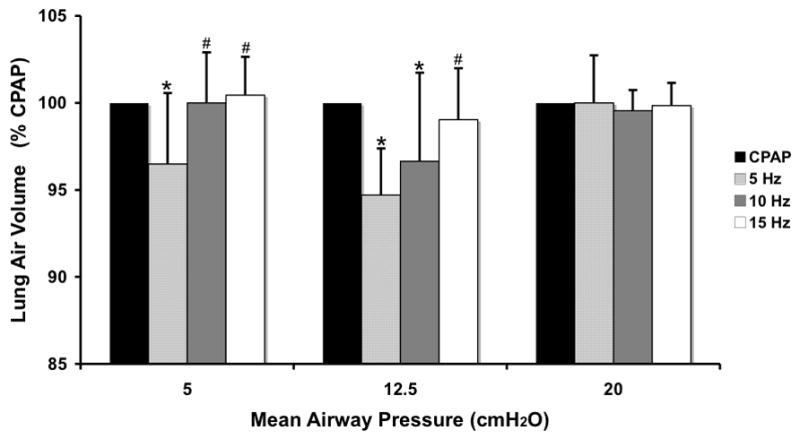
Changes in whole lung air volume during HFOV normalized to CPAP volume at the same Paw. Means±SD for 5 animals. p<0.05: * vs CPAP, # vs. 5 Hz.
Right and Left lung volumes increased proportionally with increasing Paw, and the volume distribution remained constant with fR, VT, and Paw, with 58% of lung air volume in the right lung and 42% in the left. The mean R/L volume ratio for all images was 1.36±0.12, identical to the previously reported value of 1.36±0.11 (Venegas et al. 1993).
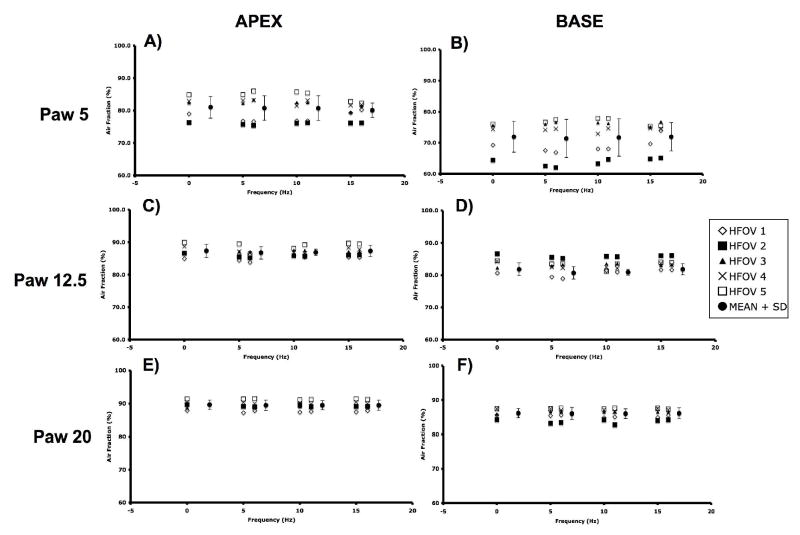
The APEX and BASE sub-volumes comprised 28±0.02 and 43±0.07%, respectively, of the total Vair at CPAP of 5 cmH2O, 26±0.03 and 45±0.07% at CPAP of 12.5 cmH2O, and 26±0.03 and 47±0.04% at CPAP of 20 cmH2O. There were no differences in the tissue volumes of the corresponding regions, suggesting that the matching of the sub-volumes was consistent. CPAP Normalized APEX and BASE sub-volumes demonstrate a pattern of fR -dependent regional volume changes (Fig. 6) similar to that seen in the whole lung (Fig. 5), with the largest volume reductions seen at 5 Hz and Paw 5 and 12.5 cmH2O, and no changes at 15 Hz or Paw 20 cmH2O. With increasing Paw, the apex to base (A/B) volume ratio fell (Paw 5 to 12.5, p=0.04; Paw 12.5 to 20, p=0.02), but there were no significant changes in the A/B volume ratio with frequency at a given Paw (Fig. 7). The peak flow difference between the high and low VT at 5 Hz was comparable to that seen between the eucapnic VT at 5 vs. 10 Hz (Fig. 8). We cannot distinguish whether we were unable to detect a difference because of our small sample size or if there is a fR -dependent effect.
Figure 6.
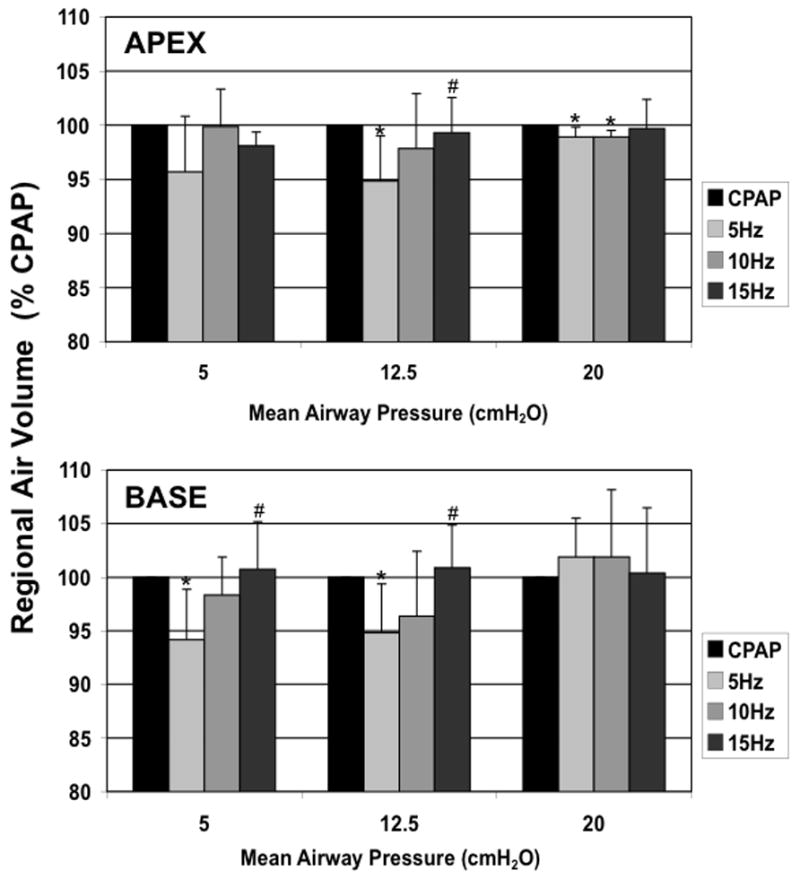
Apex and Base regional lung air volumes during HFOV normalized to CPAP volume at the same Paw. Mean±SD for 5 animals. p<0.05: * vs CPAP, + vs. 5 Hz.
Figure 7.
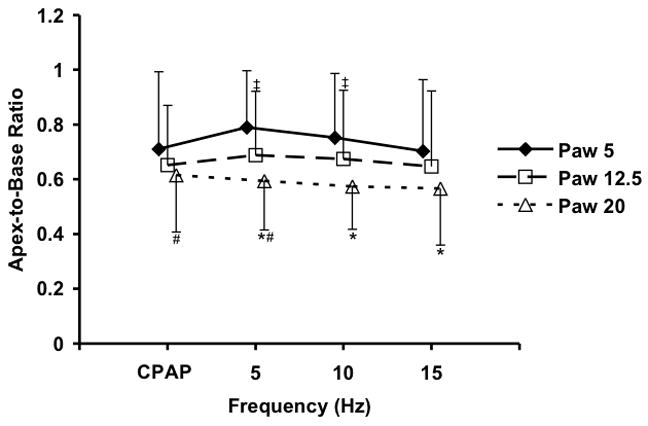
Changes in the Apex to Base volume ratio with Paw and frequency. Mean±SD for 5 animals. p<0.05 for Paw change at same frequency: * 5 vs 20 cm H2O, # 12.5 vs. 20 cm H2O, ‡ 5 vs. 12.5 cm H2O.
Figure 8.
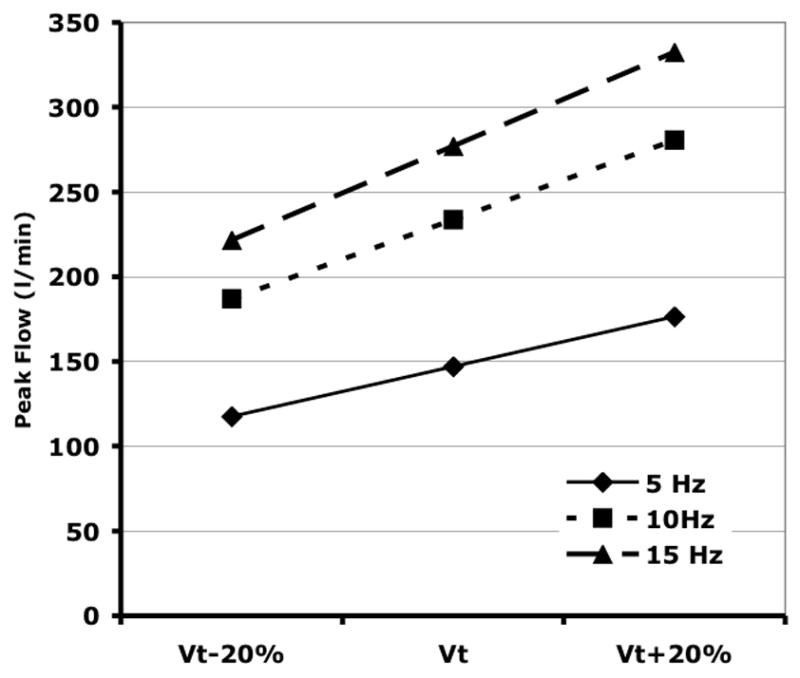
Calculated peak airflows for sinusoidal HFOV at the measured eucapnic VT and VT ± 20%. Because of the nonlinear relationship between eucapnic fR and VT (Venegas et al. 1986), the increase in peak flow from 5 to 10 Hz is greater than when changing from 10 to 20 Hz.
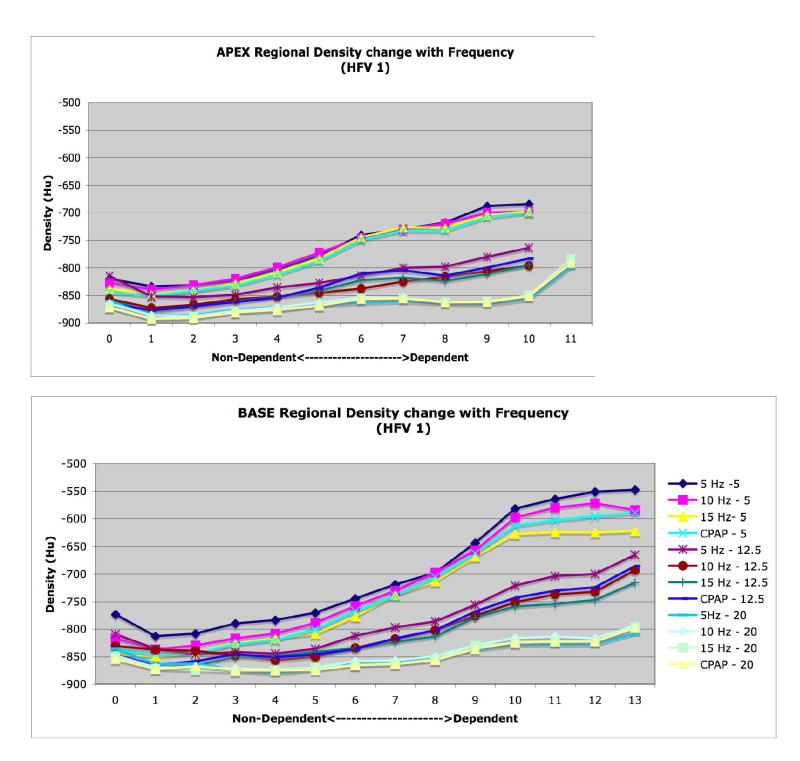
Finally, we observed vertical gradients in lung expansion, evidenced by decreasing density (increasing air content) moving from dependent to nondependent regions of both the apex and base, that changed with Paw consistent with published reports (Simon 2000; Marcucci et al. 2001). However, there were no statistically significant differences in the slopes or patterns of the vertical gradients between fR at a given Paw (data not shown).
4. Discussion
The relationship between proximally measured Paw and lung volume during HFOV has been the subject of many investigations going back almost 25 years (Saari et al. 1984; Simon et al. 1984; Allen et al. 1985a; Bryan et al. 1986; Allen et al. 1987; Pillow et al. 1999). Studies have been performed using in vitro models, open and closed-chest animals, isolated lungs, and humans and have utilized indirect measures, such as lung equilibration pressure or alveolar capsule measurements of alveolar pressure, as well as plethysmographic or image-based estimates of thoracic volume. Because a central reason for using HFOV is to raise Paw to recruit and maintain lung volume, with the goal of reducing airspace opening/closing lung injury while avoiding over-distention at end-inspiration, understanding the factors determining global and regional lung volume during HFOV remains important for clinical applications of this therapy.
In this study we used whole lung CT imaging to directly measure the steady-state distribution of lung volume in healthy, supine canines during HFOV. We found small but statistically significant decreases compared to CPAP in total and regional lung volumes that were greatest at lower frequencies (5 and 10 Hz vs 20Hz) and lower Paw. We saw no effect of a 40% change in oscillatory VT on VL. APEX and BASE sub-volumes underwent changes with fR and Paw comparable to the lung overall, and there was a preferential inflation of the base relative to the apex as Paw increased. Increases in fR were also accompanied by a modest increase in arterial oxygenation in these normal lungs. These finding provide additional insight into the impact of HFOV settings on the distribution of VL and lend validity to prior observations on mechanical behaviors of the intact lung during dynamic HFOV.
4.1 Factors affecting lung volume during HFOV
The relationship between the proximally measured Paw and the mean alveolar pressure (and by extension, lung volume) is complex. First, high HFOV flow rates can introduce artifacts into measurements of Paw which may vary with the geometry and flow characteristics of the measuring site (Simon et al. 1984). In that case, if Paw is controlled, then the system will add or remove gas volume to maintain measured Paw constant when the flow rate (fR, VT, I:E ratio) changes, changing the lung volume. In this study, Paw was measured from the lateral pressure of a flush side hole at the center of a long, straight delivery tube such as to minimize flow-dependent artifact (Simon et al. 1984; Simon et al. 1991). Second, pressures inside the lung may be elevated or reduced relative to the proximal Paw, depending on the linearity and symmetry of airflow pathways. If the HFOV expiratory pressure drop is greater than the inspiratory rise, then mean alveolar pressure will exceed Paw (Simon et al. 1984; Bryan et al. 1986; Solway et al. 1986), analogous to breath stacking or auto-PEEP in conventional ventilation. This nonlinear relationship is critically dependent on the flow patterns (fR, VT, waveform, I:E ratio, turbulence), endotracheal tube size, and lung mechanical properties, and may vary along pathways to different lung regions. Depending on conditions, alveolar pressure, and presumably lung volumes and levels of distention, during HFOV may be substantially greater or less than that obtained at the same level of constant Paw (Simon et al. 1984; Solway et al. 1986; Kamitsuka et al. 1990; Pillow et al. 1999). These effects are potentially operative on a regional as well as global level, and are of particular concern for the application of HFOV in adults since the effect could be exacerbated by structural airways or lung disease. In clinical use, HFOV is usually adjusted to use an I:E ratio of 1:2 (Fessler et al. 2007) in order to reduce expiratory flows and potential gas trapping or occult hyperinflation (Pillow et al. 1999).
In this study in healthy, supine canines, we found a small but consistent decrease in lung air volume during eucapnic HFOV at 5 Hz compared to the same Paw during CPAP. This volume difference diminished as frequency increased and was not seen at 15 Hz. In addition, increasing Paw from 5 to 20 cmH2O also eliminated the fR dependent effect. The increase in Vair with fR seen only at lower Paw is consistent with several earlier studies comparing alveolar pressure to proximal Paw (Simon et al. 1984; Bryan et al. 1986; Solway et al. 1986). Using positron imaging, however, Venegas and coworkers did not observe an increase in lung volume with increasing fR from 1 to 15 Hz during eucapnic HFOV (Venegas et al. 1993), although it is possible that this planar projection technique was not sensitive enough to detect the small differences we observed. The explanation commonly provided for the loss of fR dependence with increasing Paw is that increased airways diameter and stiffness with reduced dynamic expiratory flow limitation seen at elevated lung volumes reduces the difference in inspiratory and expiratory impedance responsible for the effect (Simon et al. 1984; Bryan et al. 1986; Solway et al. 1986; Pillow et al. 1999). In general one would expect this effect to be related to the peak flow rates (Simon et al. 1984), but we did not observe a change in lung volume between the high and low VT at the same frequency.
The fall in Vair during HFOV compared to constant Paw CPAP was unexpected, and we were unable to find comparable direct measures of lung volume under similar conditions in the literature. While we initially assumed that mean lung elastic recoil would be the same under static and oscillatory conditions, if oscillation caused a reflex or mechanical increase in tissue elastance then lung volume during HFOV could be smaller at the same mean alveolar pressure. For example, it has been shown that a breath hold can induce a vagal-mediated airways constriction that is augmented by a prior deep inspiration (Brown et al. 1994). Another possibility is increased regional ventilation resulting in localized hypocapnic pneumoconstriction with increased lung recoil (Simon et al. 1997). However, our current imaging technique precludes sufficient airway resolution for answering this question.
4.2 Regional effects
As Paw increased, lung volume increased preferentially toward the lung base, consistent with the restrictive nature of the apical chest wall and the relatively easily displaced diaphragm (Venegas et al. 1993). However, there was no effect of HFOV fR on the right-to-left or apex-to-base distribution of mean lung volume, consistent with the findings of Venegas et al. (Venegas et al. 1993) using positron imaging in intact dogs. In excised canine lungs, Allen and coworkers found a modest interregional heterogeneity among alveolar pressures measured with the alveolar capsule technique, with the base mean pressure exceeding the apex with increasing fR, up to about 1 cmH2O at 16 Hz and 80 ml VT. This small difference, noted by the authors to be on the order of that caused by the vertical gradient in pleural pressure, may have been reduced by the presence of the intact chest wall or may be too small to affect measured regional volume.
4.3 Additional considerations
There are additional potential sources of error that need to be considered. First, Paw was actively controlled using a closed loop servo system. All closed loop systems can be subject to slow oscillations, and thus prior to imaging Paw was confirmed to be stable, with less than 0.5 cmH2O amplitude fluctuations. While it is possible that that low amplitude pressure oscillations at the lower HFOV fR’s could result in reduced lung volume, based on the measured in vivo lung compliance (Fig. 4) it would require pressure swings on the order of 0.75 cmH2O at Paw=5 and 1.3 cmH2O at Paw= 12.5 cmH2O to change lung volume by 5%. In addition, these oscillations would be expected to be sampled randomly and thus should average out over different animals, so it is unlikely that this effect is responsible for the observed fall in VL at 5 and 10 Hz. Secondly, image registration and segmentation errors could contribute to a systematic underestimation of VL. Since imaging was performed during steady-state HFOV, lung volume cycled during image acquisition. At the lowest frequency of 5 Hz, 2.5 HFOV cycles occurred during each 0.5 sec image acquisition, which should provide for adequate averaging of lung density. Although there was no visible motion artifact (Fig. 1), it is possible that subtle blurring at the lung boundary biased the segmentation to reduce VL, an effect that would be greatest at the lowest fR and largest VT. However, it seems highly unlikely that this effect could account for the approximately 40 ml average decrease in VL seen at 5 Hz and, furthermore, the volume changes correlated with oxygenation changes which suggests that they are real. Alternatively, the increase in oxygenation with frequency could also be due to an increase in ventilation to the base with improved ventilation-perfusion. Similar alterations of ventilation-perfusion matching comparing apex-to-base differences with PET imaging have suggested this as a possibility for changing PaO2 and PaCO2. (Venegas et al. 1988). There is also potential for error in matching lung apex and base subvolumes between image sets, particularly since we were limited to including or excluding lung based on incremental whole slices (Figure 2) and the lung may not expand uniformly in dependent vs. non-dependent regions. However, the constancy of lung tissue volume between whole and regional volumes is reassuring that any error due to registration effects is small.
5. Conclusions
In summary, we found that during eucapnic HFOV of healthy, supine dogs, mean lung volume fell slightly at 5 Hz compared to the same static Paw and then increased back to baseline as oscillatory frequency increased to 15 Hz. This effect was most pronounced at low Paw and was not observed at Paw of 20 cmH2O. There were no major regional differences in lung volume distribution. These results suggest that, under these normal conditions, occult lung overdistention is not a significant risk. Further work will determine whether the distribution of regional tidal volume and gas exchange are also uniformly distributed and how heterogeneous lung injury and mechanical properties affect mean and regional volume distributions.
Figure A.
Figure B.
Acknowledgments
The authors gratefully acknowledge the expert technical assistance of H. Tim Burman in the lab and Phil Keller in the CT suite. Thanks to Dr. Eric Hoffman, Dept. of Radiology, Division of Physiologic Imaging, University of Iowa, Iowa City, IA for the PASS image analysis software system, and Dr. Kieran Murphy of Dept. of Radiology, The Johns Hopkins Hospital, for facilitating access to the CT scanner. Supported by NIH Biomedical Engineering Partnership HL64368 and NIH SCCOR Program in Acute lung Injury HL073994.
Footnotes
Publisher's Disclaimer: This is a PDF file of an unedited manuscript that has been accepted for publication. As a service to our customers we are providing this early version of the manuscript. The manuscript will undergo copyediting, typesetting, and review of the resulting proof before it is published in its final citable form. Please note that during the production process errors may be discovered which could affect the content, and all legal disclaimers that apply to the journal pertain.
References
- Allen JL, Frantz ID, Fredberg JJ. Regional alveolar pressure during periodic flow. Dual manifestations of gas inertia. J Clin Invest. 1985a;76:620–629. doi: 10.1172/JCI112014. [DOI] [PMC free article] [PubMed] [Google Scholar]
- Allen JL, Frantz ID, III, Fredberg JJ. Heterogeneity of mean alveolar pressure during high-frequency oscillations. Journal of Applied Physiology. 1987;1987:223–228. doi: 10.1152/jappl.1987.62.1.223. [DOI] [PubMed] [Google Scholar]
- Allen JL, Fredberg JJ, Keefe DH, Frantz ID., III Alveolar pressure magnitude and asynchrony during high-frequency oscillations of excised rabbit lungs. Am Rev Respir Dis. 1985b;132:343–349. doi: 10.1164/arrd.1985.132.2.343. [DOI] [PubMed] [Google Scholar]
- Brown RH, Herold C, Zerhouni EA, Mitzner W. Spontaneous airways constrict during breath holding studied by high - resolution computed tomography. Chest. 1994;106:920–924. doi: 10.1378/chest.106.3.920. [DOI] [PubMed] [Google Scholar]
- Bryan AC, Slutsky AS. Long volume during high frequency oscillation. Am Rev Respir Dis. 1986;133:928–930. [PubMed] [Google Scholar]
- Cha EJ, Chow E, Chang HK, Yamashiro SM. Lung hyperinflation in isolated dog lungs during high-frequency oscillation. J Appl Physiol. 1988;65:1172–1179. doi: 10.1152/jappl.1988.65.3.1172. [DOI] [PubMed] [Google Scholar]
- Fessler HE, Brower RG. Protocols for lung protective ventilation. Crit Care Med. 2005;33:S223–227. doi: 10.1097/01.ccm.0000155919.53727.d5. [DOI] [PubMed] [Google Scholar]
- Fessler HE, Derdak S, Ferguson ND, Hager DN, Kacmarek RM, Thompson BT, Brower RG. A protocol for high-frequency oscillatory ventilation in adults: results from a roundtable discussion. Crit Care Med. 2007;35:1649–1654. doi: 10.1097/01.CCM.0000269026.40739.2E. [DOI] [PubMed] [Google Scholar]
- Froese AB, Kinsella JP. High-frequency oscillatory ventilation: lessons from the neonatal/pediatric experience. Crit Care Med. 2005;33:S115–121. doi: 10.1097/01.ccm.0000155923.97849.6d. [DOI] [PubMed] [Google Scholar]
- Hoffman EA, Reinhardt JM, Sonka M, Simon BA, Guo J, Saba O, Chon D, Samrah S, Shikata H, Tschirren J, Palagyi K, Beck KC, McLennan G. Characterization of the interstitial lung diseases via density-based and texture-based analysis of computed tomography images of lung structure and function. Acad Radiol. 2003;10:1104–1118. doi: 10.1016/s1076-6332(03)00330-1. [DOI] [PubMed] [Google Scholar]
- Kamitsuka MD, Boynton BR, Villanueva D, Vreeland PN, Frantz ID., 3rd Frequency, tidal volume, and mean airway pressure combinations that provide adequate gas exchange and low alveolar pressure during high frequency oscillatory ventilation in rabbits. Pediatr Res. 1990;27:64–69. doi: 10.1203/00006450-199001000-00018. [DOI] [PubMed] [Google Scholar]
- Luecke T, Herrmann P, Kraincuk P, Pelosi P. Computed tomography scan assessment of lung volume and recruitment during high-frequency oscillatory ventilation. Crit Care Med. 2005;33:S155–162. doi: 10.1097/01.ccm.0000155916.47455.df. [DOI] [PubMed] [Google Scholar]
- Marcucci C, Nyhan D, Simon BA. Distribution of pulmonary ventilation using Xe-enhanced computed tomography in prone and supine dogs. J Appl Physiol. 2001;90:421–430. doi: 10.1152/jappl.2001.90.2.421. [DOI] [PubMed] [Google Scholar]
- Otis AB, McKerrow CB, Bartlett RA, Mead J, McIlroy MB, Selverstone NJ, Radford EP. Mechanical factors in distribution of pulmonary ventilation. J Appl Physiol. 1956;8:427–442. doi: 10.1152/jappl.1956.8.4.427. [DOI] [PubMed] [Google Scholar]
- Pillow JJ, Neil H, Wilkinson MH, Ramsden CA. Effect of I/E ratio on mean alveolar pressure during high-frequency oscillatory ventilation. J Appl Physiol. 1999;87:407–414. doi: 10.1152/jappl.1999.87.1.407. [DOI] [PubMed] [Google Scholar]
- Saari AF, Rossing TH, Solway J, Drazen JM. Lung inflation during high-frequency ventilation. Am Rev Respir Dis. 1984;129:333–336. [PubMed] [Google Scholar]
- Simon BA. Non-invasive imaging of regional lung function using X-ray computed tomography. J Clin Monit. 2000;16:433–442. doi: 10.1023/a:1011444826908. [DOI] [PubMed] [Google Scholar]
- Simon BA. Regional ventilation and lung mechanics using X-ray CT. Acad Radiol. 2005;12:1414–1422. doi: 10.1016/j.acra.2005.07.009. [DOI] [PubMed] [Google Scholar]
- Simon BA, Mitzner W. Design and calibration of a high-frequency oscillatory ventilator. IEEE Trans Biomed Eng. 1991;38:214–218. doi: 10.1109/10.76389. [DOI] [PubMed] [Google Scholar]
- Simon BA, Tsuzaki K, Venegas JG. Changes in regional lung mechanics and ventilation distribution after unilateral pulmonary artery occlusion. JAP. 1997;82:882–891. doi: 10.1152/jappl.1997.82.3.882. [DOI] [PubMed] [Google Scholar]
- Simon BA, Weinmann GG, Mitzner W. Mean airway pressure and alveolar pressure during high-frequency ventilation. J Appl Physiol: Respirat Environ Exercise Physiol. 1984;57:1069–1078. doi: 10.1152/jappl.1984.57.4.1069. [DOI] [PubMed] [Google Scholar]
- Solway J, Rossing TH, Saari AF, Drazen JM. Expiratory flow limitation and dynamic pulmonary hyperinflation during high-frequency ventilation. J Appl Physiol. 1986;60:2071–2078. doi: 10.1152/jappl.1986.60.6.2071. [DOI] [PubMed] [Google Scholar]
- Tsuda A, Fredberg JJ. Periodic flow at airway bifurcations. I. Development of steady pressure differences. J Appl Physiol. 1990a;69:546–552. doi: 10.1152/jappl.1990.69.2.546. [DOI] [PubMed] [Google Scholar]
- Tsuda A, Kamm R, Fredberg JJ. Periodic flow at airway bifurcations. II. Flow partitioning. J Appl Physiol. 1990b;69:553–561. doi: 10.1152/jappl.1990.69.2.553. [DOI] [PubMed] [Google Scholar]
- Venegas JG, Fredberg JJ. Understanding the pressure cost of ventilation: why does high-frequency ventilation work? Critical Care Medicine. 1994;22:S49–57. doi: 10.1097/00003246-199422091-00004. [DOI] [PubMed] [Google Scholar]
- Venegas JG, Hales CA, Strieder DJ. A general dimensionless equation of gas transport by high-frequency ventilation. Journal of Applied Physiology. 1986;60:1025–1030. doi: 10.1152/jappl.1986.60.3.1025. [DOI] [PubMed] [Google Scholar]
- Venegas JG, Tsuzaki K, Fox BJ, Simon BA, Hales CA. Regional coupling between chest wall and lung expansion during HFV: A positron imaging study. J Appl Physiol. 1993;74:2242–2252. doi: 10.1152/jappl.1993.74.5.2242. [DOI] [PubMed] [Google Scholar]
- Venegas JG, Yamada Y, Custer J, Hales CA. Effects of respiratory variables on regional gas transport during high-frequency ventilation. Journal of Applied Physiology. 1988;64:2108–2118. doi: 10.1152/jappl.1988.64.5.2108. [DOI] [PubMed] [Google Scholar]


