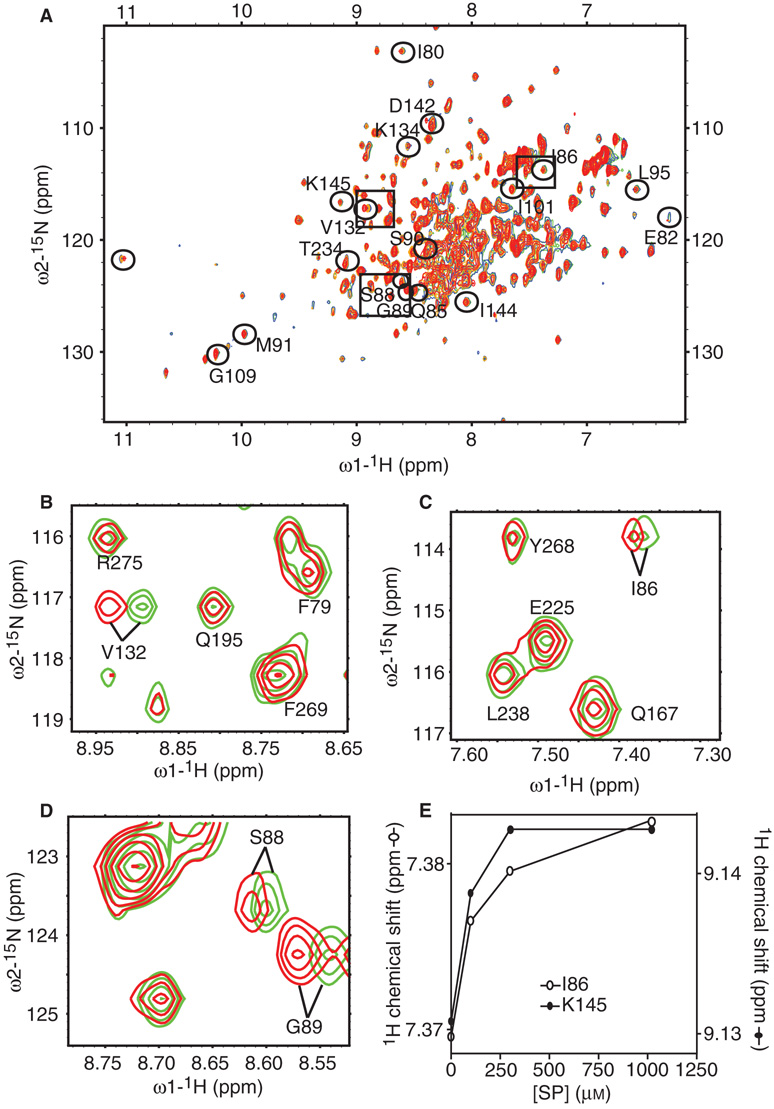
Figure 1.
Assignment of peaks corresponding to residues in the SPase I Δ2–75 amino acid sequence that change in backbone conformation upon signal peptide binding. (A) 2D 1H-15N HSQC spectra of SPase I Δ2–75 with increasing concentration of signal peptide ([SPase I Δ2–75] = 0.3 mm, no signal peptide (green), [signal peptide] = 0.100 mm (blue), [signal peptide] = 0.300 mm (yellow), [signal peptide] = 1 mm (red)). Peaks that shifted due to peptide binding are circled and marked with the corresponding residue identification where applicable. (B) Representative region of 2D 1H-15N HSQC spectra of SPase I Δ2–75, shows the superposition of the spectra of free SPase I Δ2–75 (green) and SPase I Δ2–75 in complex with 1 mm signal peptide (red) as in (A). Shown is a peak corresponding to residue Val132 that shifted with signal peptide addition. Other peaks that did not shift are also identified. (C) Representative region of 2D 1H-15N HSQC spectra of SPase I Δ2–75 as in (B). Shown is a peak corresponding to residue Ile86 that shifted with signal peptide addition. Other peaks that did not shift are also identified. (D) Representative region of 2D 1H-15N HSQC spectra of SPase I Δ2–75 as in (B). Shown are peaks corresponding to residues Ser88 and Gly89 that shifted with signal peptide addition. (E) Example titration curves showing saturation of chemical shift changes corresponding to residues Ile86 and Lys145 of SPase I Δ2–75 upon increasing signal peptide concentration.

