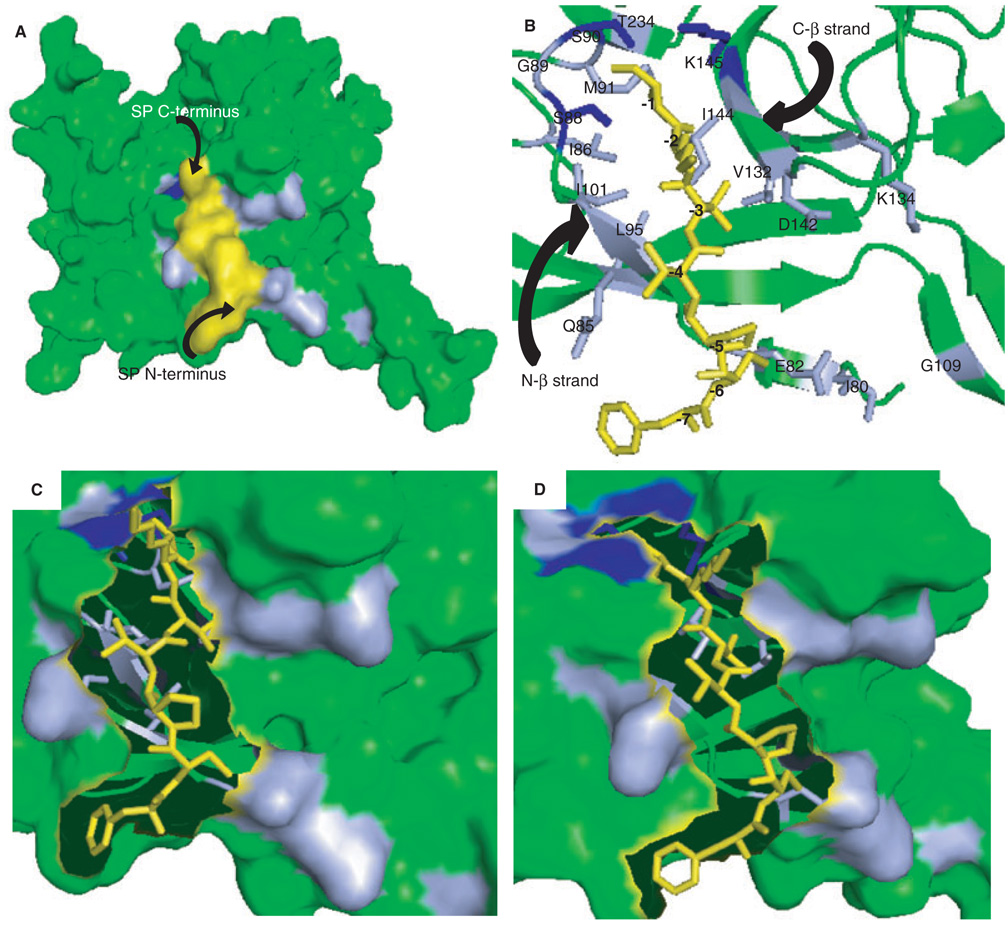
Figure 3.
Models of the signal peptide-SPase I Δ2–75 complex. (A) Residues identified in 2D 1H-15N HSQC spectra that changed in backbone conformation upon signal peptide binding (Figure 1A) are marked on the surface representation of SPase I Δ2–75 in complex with a model of the wild-type alkaline phosphatase signal peptide. Amino acids in light blue showed shifts in resonances, those proposed to be critical to the proteolytic mechanism and showed shifts are depicted in dark blue. The signal peptide model is shown in yellow. (B) Magnified view of the alkaline phosphatase signal peptide-SPase I Δ2–75 complex, represented by a stick and ribbon diagram, respectively. Residues of SPase I Δ2–75 involved in signal peptide binding as found by NMR analysis are indicated and color coded as in (A). The signal peptide model is shown in yellow and residues are numbered relative to the cleavage site: (−1) Ala, (−2) Lys, (−3) Thr, (−4) Val, (−5) Pro, (−6) Cys, (−7) Phe. (C) Surface representation of the magnified view of SPase I Δ2–75 and signal peptide (represented as sticks), showing the residues on the N-terminal beta strand (residues 85–90) of the signal peptide binding cleft. (D) Surface representation of a magnified view of SPase I Δ2–75 and signal peptide represented as sticks, showing the residues on the C-terminal beta strand (residues 142–145) of the signal peptide binding cleft. All figures were prepared using PyMOL Viewer Software and the coordinates from the model of the wild-type SPase I Δ2–75 complex with the cleavage region of the beta-lactamase signal peptide (5) as described in Materials and Methods.

