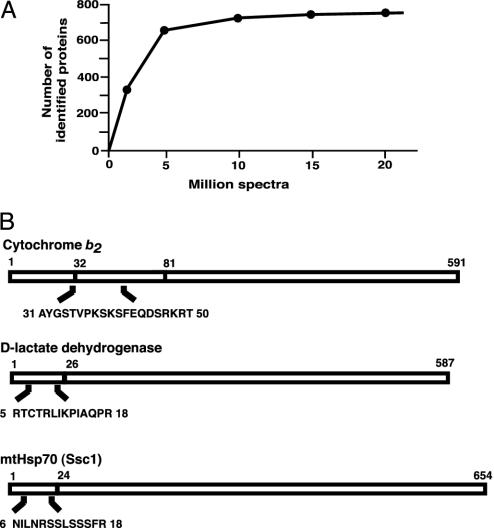
Fig. 4.
Identification of mitochondrial proteins and presequences. (A) Number of identified different proteins per million MS spectra. (B) Identification of presequence segments in proteins of the mitochondria-associated fraction. The sequences of the identified peptides found closest to the N terminus are shown. Numbers refer to amino acid positions, starting with the first residue of the presequences. The first and last residues of the mature proteins are indicated. Cytochrome b2 is processed in two steps, after residues 31 and 80 (49).

