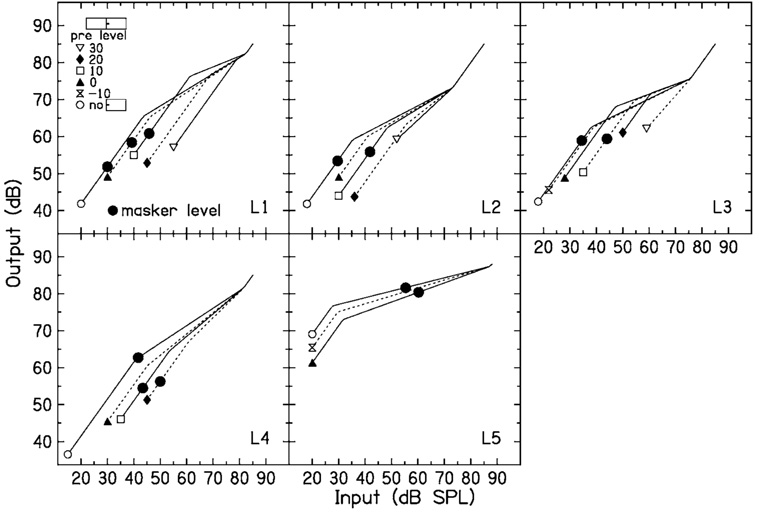
FIG. 6.
The input–output functions from Fig. 3 are used as estimates of the input–output functions at the suppressor place. The symbols are masker values from Fig. 5 for signal levels of 35 (L3, L4), 40 (L1, L2), or 50 dB SPL (L5), the lowest signal levels for which multiple points could be plotted. In general, the output levels for the maskers are approximately equal, which would be consistent with the hypothesis that they are producing equal suppression of the signal.

