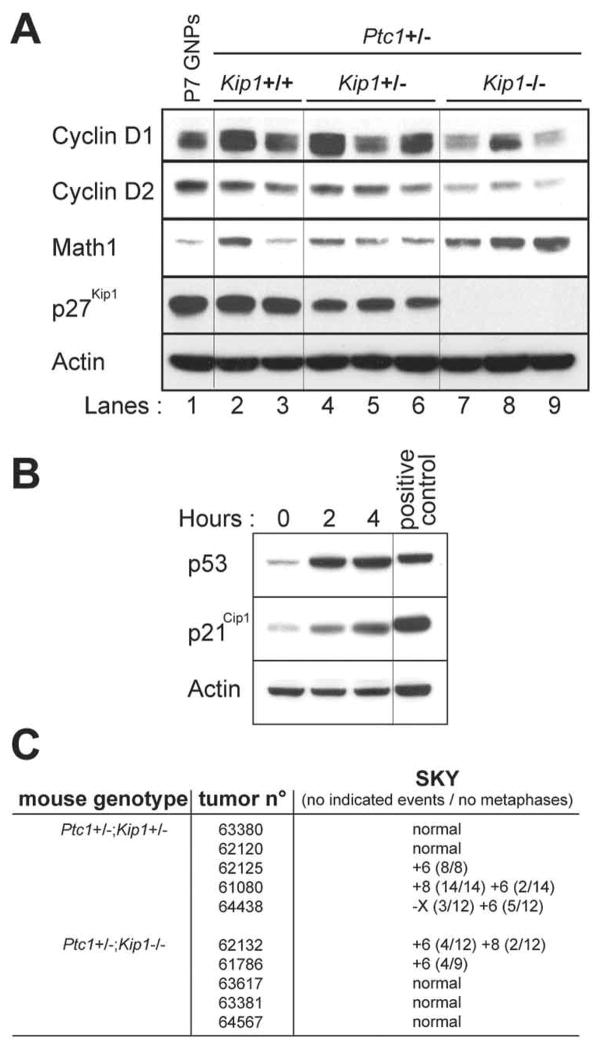
FIGURE 4.
Molecular analysis of GNPs and MBs. A. Immunoblotting of the indicated proteins (left) expressed in primary GNPs purified from a cerebellum of a P7 wild type mouse and from GNP-like tumor cells purified from MBs occurring in Ptc1+/− mice lacking no (+/+), one (+/−) or two (−/−) Kip1 alleles. Actin was used as loading control. B. Accumulation of p53 and p21Cip1 2 and 4 hours after exposure to 15 Gy ionizing radiation in tumor cells purified from MBs from Ptc1+/−;Kip1−/− mice. Zn2+-treated MT-Arf cells were used a positive control. C. Spectral karyotyping (SKY) of MBs from representative tumors arising in Ptc1+/−;Kip1+/− and Ptc1+/−;Kip1−/− animals was used to determine the nature and frequency of chromosomal anomalies.

