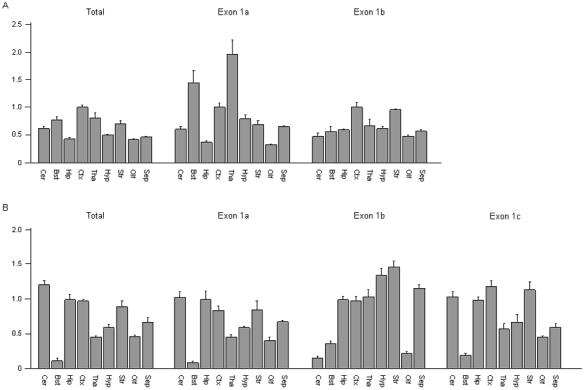
Figure 3.

Quantitative differences in the expression levels of distinct Scn1a and Scn2a transcripts. Real-time RT-PCR analysis was used to compare the expression pattern of (A) total Scn1a to transcripts in which exon 1a and exon 1b spliced directly to exon 1, and (B) total Scn2a to transcripts in which exon 1a, exon 1b, and exon 1c spliced directly to exon 1. Brain regions examined: Cer, cerebellum; Bst, brainstem; Hip, hippocampus; Ctx, cortex; Tha, thalamus; Hyp, hypothalamus; Str, striatum; Olf, olfactory; Sep, septum. Scn1a transcripts were normalized to the level of expression in cortex. Scn2a transcripts were normalized to the level of expression in hippocampus. Each bar represents the average value from the analysis of brain tissue from three mice. Error bars represent the SEM.
