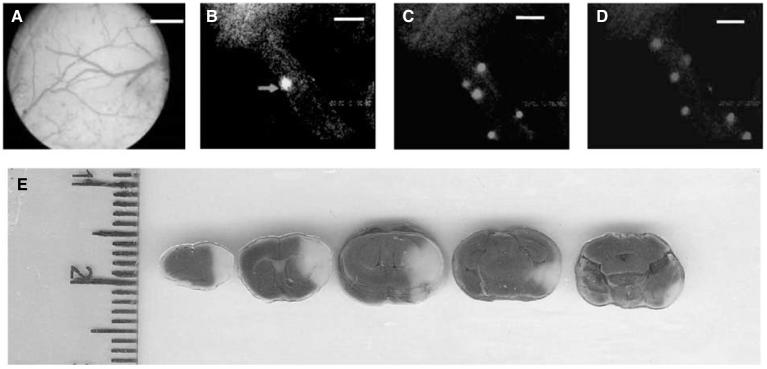
Figure 2.
Typical closed cranial window in a mouse. Scale bar = 500 μm (A). Representative video images of capturing leukocytes labeled with Rhodamine 6G in the ischemic area. Video images were taken before MCAO (B), one hour after MCAO (C), and 24 h after MCAO (D) in the same venule. Arrows indicate Rhodamine 6G-labeled leukocytes flowing through venules. Scale bar = 40 μm. Representative brain slices after 1 h MCAO followed by 23 h reperfusion. Slices were stained with 2% triphenyltetrazolium chloride. The unstained areas (white) represent the infarct lesion corresponding to the middle cerebral artery distribution territory (E).

