
Figure 1.
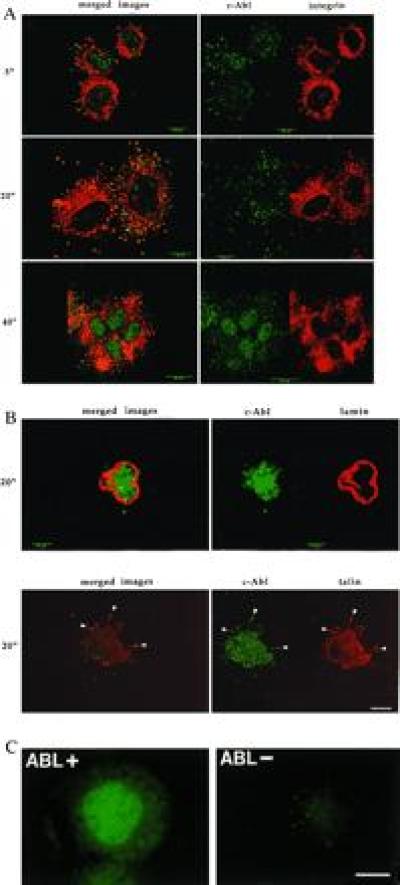
c-Abl localization during cell adhesion. (A) 10T½ cells were plated on FN in serum-free medium. Cells were fixed at the indicated times and stained with monoclonal antibody 8E9 to c-Abl (green) or a polyclonal antibody to the α5-integrin subunit (red). The images on the left show the Abl and integrin staining patterns merged. Yellow indicates codistribution. Confocal images represent the 1-μm plane nearest the substratum. (Bars: 5-min and 20-min time points, 10 μm; 40-min time point, 25 μm.) (B Upper) Cells plated on polylysine (PL) for 20 min. Cells were stained for c-Abl (green) or nuclear lamins (red) to identify the nucleus. No transport of c-Abl out of the nucleus was observed at any time between 5 and 60 min after plating (data not shown). (Lower) Colocalization with talin. Cells were stained for c-Abl (green) or talin (red). Merged images are shown on the left. Yellow indicates codistribution. (Bars: Upper, 5 μm; Lower, 10 μm.) (C) 3T3 cells isolated from abl−/− mice (Abl−) (Right) or cells that were reconstituted with c-Abl (Left) were plated for 24 hr on coverslips. Cells were stained with the 8E9 antibody for c-Abl. (Bar = 25 μm.)