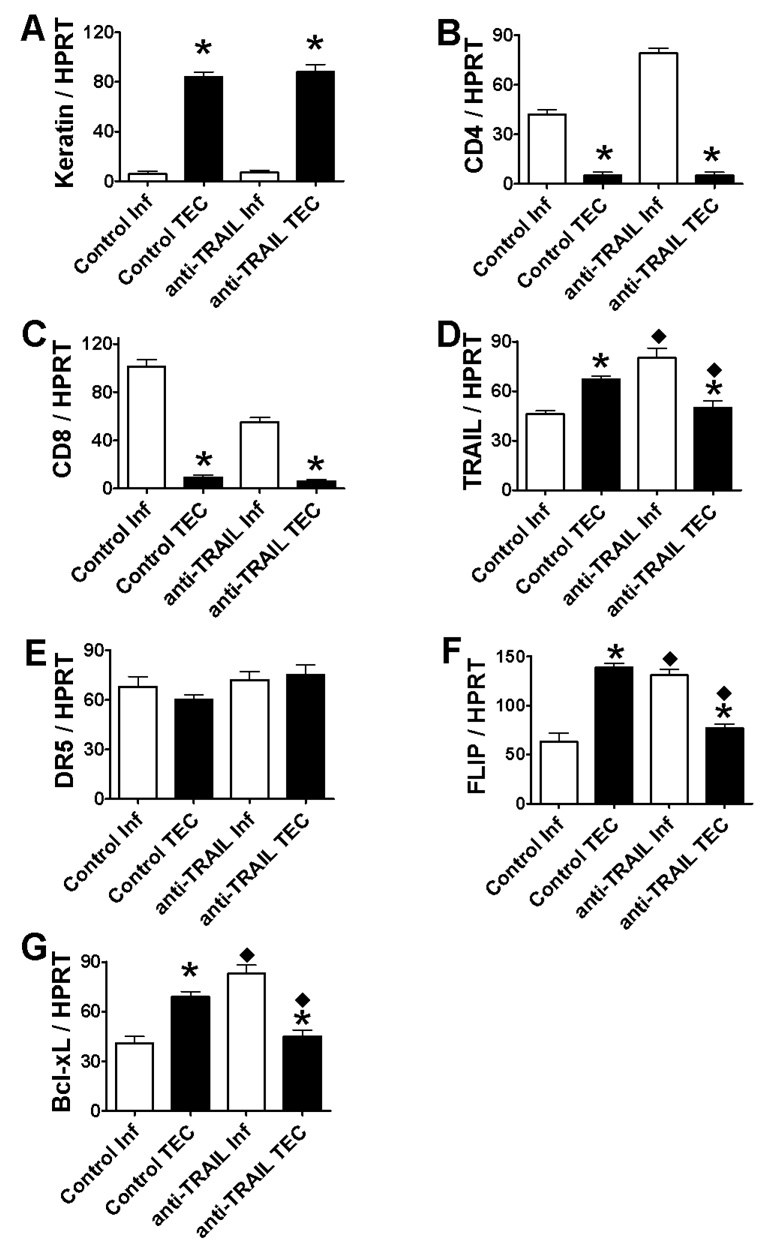
Figure 3. mRNA expression of pro- and anti-apoptotic molecules on TEC vs. thyroid-infiltrating inflammatory cells in thyroids.
Thyroid-infiltrating inflammatory cells were isolated from thyroids of 5–6 IgG-treated or anti-TRAIL-treated recipients with 4–5+ G-EAT severity scores at day 20 as described in Methods. The fraction that was depleted of inflammatory cells was obtained and designated TEC fraction (see Methods). RNA was extracted and cDNA was prepared and amplified with specific primers as described in Methods. Expression of keratin, CD4 and CD8 mRNA (A–C), or pro-apoptotic molecules TRAIL and DR5 mRNA (D and E), and anti-apoptotic molecules FLIP and Bcl-xL (F and G) is shown. Results are expressed as the mean ratio of densitometric U/HPRT ± SEM (×100), and are representative of two independent experiments. A significant difference between inflammatory cells and TEC isolated from IgG-treated (control) or anti-TRAIL-treated mice is indicated by the asterisk (p < 0.05). TRAIL, FLIP and Bcl-xL were also expressed higher in inflammatory cells and lower in TEC when the same cell types (inflammatory cells or TEC) were compared between the two groups (control vs. anti-TRAIL). A significant difference is indicated by the diamond (p < 0.05).

