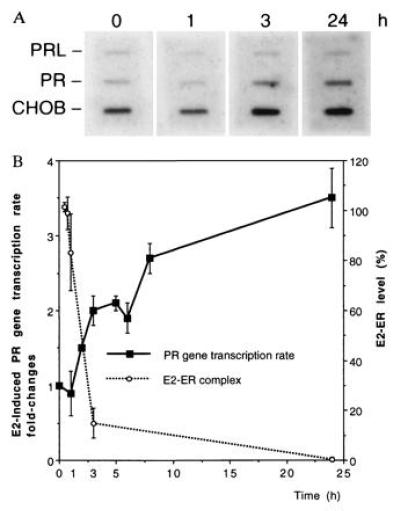
Figure 2.

Time course of PR mRNA transcription rate after E2 treatment. Rat1+ER cells were treated with E2 (10 nM) for the indicated times and the nuclei were isolated. Nuclei were incubated with 32P-UTP and other ribonucleotides to label nascent transcripts from engaged RNA polymerases. The steady-state number of RNA polymerases, i.e., transcription rate, was determined by hybridizing 32P-labeled primary transcripts to the plasmids immobilized on the membrane. (A) One representative nuclear run-on blot is shown with each plasmid designated. For detailed description of plasmids, see Materials and Methods. Time periods for E2 treatments are labeled at the top. (B) The blots were quantified by PhosphorImager. PR gene transcription rates were normalized to those of CHOB after subtracting backgrounds. The results were expressed as fold-changes relative to the control value. The quantified results represent an average of four independent experiments and are shown on the right, vertical axis. The E2–ER level was measured by whole cell uptake using the same E2 concentration, as shown in Fig. 3A. The data are overlaid on the left, y axis as a dashed line.
