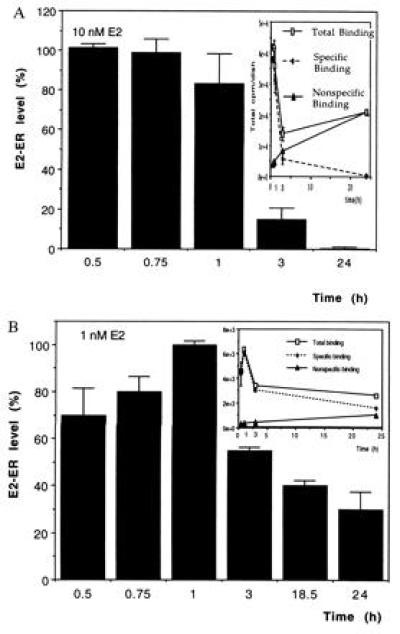
Figure 3.

Time course of E2 binding after E2 treatment. (A) Rat1+ER cells were incubated with 10 nM [3H]E2 for the indicated times. Total binding was measured from incubations with 10 nM [3H]E2, and nonspecific binding was measured from incubations with 10 nM [3H]E2 plus a 100-fold excess of unlabeled E2. Specific binding was calculated by subtracting the nonspecific counts from the total counts. The E2–ER level is expressed as the percent change of specific binding relative to the binding at 30 min of E2 treatment. The initial E2 binding curve for one experiment is shown in the inset. (B) The results from whole cell [3H]E2 uptake assays using 1 nM [3H]E2 are shown. Specific binding is expressed as percentage change relative to the binding at 1 h of E2 treatment. The inset shows the raw binding data from one experiment. The results represent an average of two experiments.
