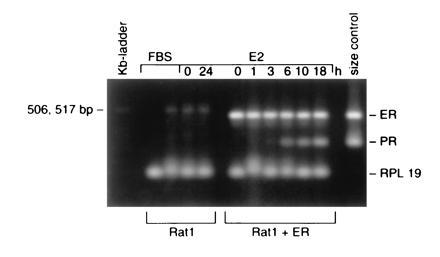
Figure 4.

Time-course of PR mRNA accumulation after E2 treatment. An agarose gel of the amplified RT-PCR products is shown. Rat1 cells were treated with medium containing 10% FBS without E2 in duplicate, 10% ST-FBS without E2, or 10% ST-FBS with E2 for 24 h. Rat1+ER cells were treated with medium containing 10% ST-FBS with 10 nM E2 for the indicated times. Total RNA was isolated and reverse-transcribed. Each RT reaction was PCR amplified with ER primers, PR primers, and RPL19 primers. PCR products were analyzed on a 2.5% agarose gel and visualized by ethidium bromide staining. Each amplicon with the correct, expected size is designated. Treatment conditions are indicated at the top. Total RNAs from Rat1 and Rat1+ER cells are labeled at the bottom. DNA amplified from the ER and PR cDNA is run in parallel as a size marker in addition to a 1-kb ladder.
