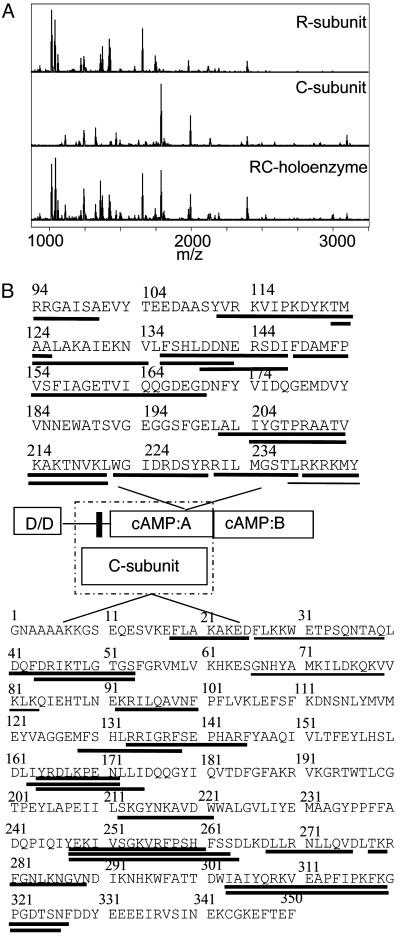
Fig. 1.
(A) MALDI-TOF mass spectrum of the peptic digest from RIα (Top), from the C-subunit (Middle), and from the RIα2–C2 holoenzyme (Bottom). (B) Sequence of the RIα(94–244) and C-subunit showing the fragments that were observed in the mass spectrum of the peptic digest. Lines underneath the sequence are fragments for which quantifiable data were obtained. A schematic is provided showing the domains of each protein, and the dashed box encloses those domains known to participate in the R–C interaction. In the regulatory subunit, D/D refers to the dimerization/docking domain, and the black bar shows the pseudosubstrate/inhibitor sequence.

