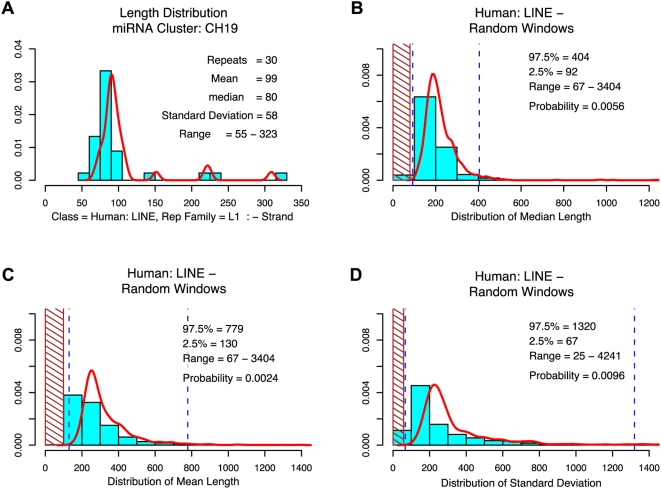
Figure 4. LINE minus strand repeat length variation is significantly smaller in C19MC compared to the rest of chromosome 19.
Panel A) Length distribution of C19MC of human LINE minus strand integrations. The superimposed red curved line indicates the kernel density estimate for the distribution. Panel B) Shaded areas indicate the region where mean length of the random windows is smaller than the mean length of C19MC. The dashed lines indicate the 2.5% and 97.5% percentiles of the mean length distribution of random windows. P-value is the proportion of mean length numbers which are smaller than the mean length of C19MC. Panel C) and D) similar to B) but the distribution of the Mean (C) and respectively the standard deviation (D) were computed.

