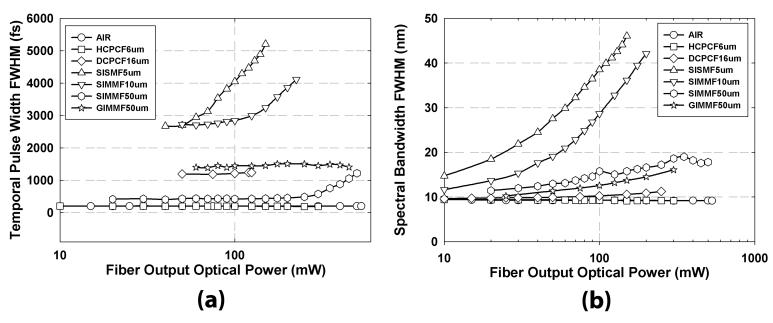
Fig. 3.
(a) Temporal pulse width and (b) spectral bandwidth of the optical pulse after various fiber delivery methods are plotted. Free space delivery is included as a reference. The x-axis represents fiber output optical power on a logarithmic scale for both (a) and (b). HCPCF6um demonstrates intact optical pulse delivery from the experimental results.

