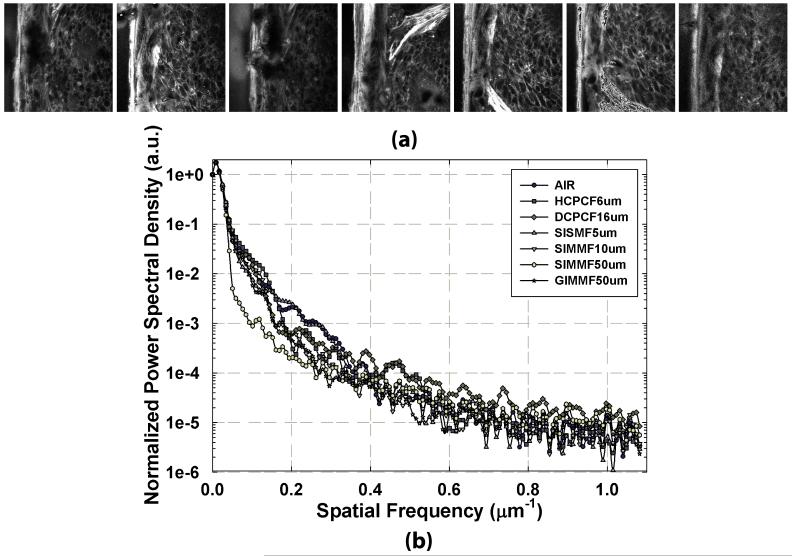
Fig. 6.
(a) Two-photon excitation fluorescence images for H&E-stained ex-vivo human skin with different fiber delivery methods. From left to right: AIR, HCPCF6um, DCPCF16um, SISMF5um, SIMMF10um, SIMMF50um and GIMMF50um (b) The power spectra of images obtained with different fiber delivery methods. Power spectral image analysis was performed on a series of human skin images obtained in (a). At low spatial frequency range, the images acquired using fibers with small number of modes have higher power spectral densities than those with large number of modes. At high spatial frequency region, power spectral density levels for all the fiber delivery methods, including free space delivery, are same since noise dominates at this regime. The maximum spatial frequency for given NA is 2.3 μm-1

