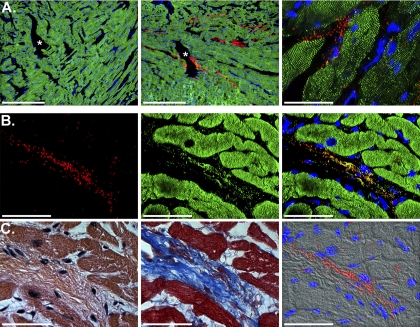
Fig. 9.
Mitochondrial viability and biodistribution after 120 min of reperfusion. A: representative confocal-microscopic images of tissue sections (5–7 μm) from AAR of RI-vehicle and RI-Mito hearts after 120 min of reperfusion. Left: sham control tissue section from AAR injected with MitoTracker Orange CMTMRos-labeled injection vehicle. No labeling of mitochondria was observed in RI-vehicle hearts. Middle: tissue section from AAR of RI-Mito heart injected with vehicle containing mitochondria (7.7 × 10⁶ ± 1.5 × 10⁶/ml). Injected mitochondria labeled with MitoTracker Orange CMTMRos were viable after 120 min reperfusion. Right: higher-power view of stained mitochondria. Note labeled mitochondria >2–3 mm from site of injection in subendocardium. Red, injected mitochondria; green, immunofluorescently stained microfilament protein α-actinin-2. Scale bars, 500 μm (left and middle) and 50 μm (right). *, Injection sites. B: RI-Mito heart tissue section from AAR shown in A. Left: injected mitochondria labeled with MitoTracker Orange. Middle: same tissue section stained with MitoFluor Green. Right: combined image. Injected mitochondria were viable and present within the myocardium after 120 min of reperfusion; <0.05% of MitoTracker Orange CMTMRos-labeled mitochondria were nonviable. Scale bars, 50 μm. C: adjacent serial sections stained with hematoxylin-eosin or Masson's trichrome (left and middle) and stained mitochondria overlaid on a differential interference contrast (DIC II) image (right). In fluorescently stained panels, nuclei were stained blue with 4′,6-diamidino-2-phenylindole. Scale bars, 50 μm.

