
FIG. 1.
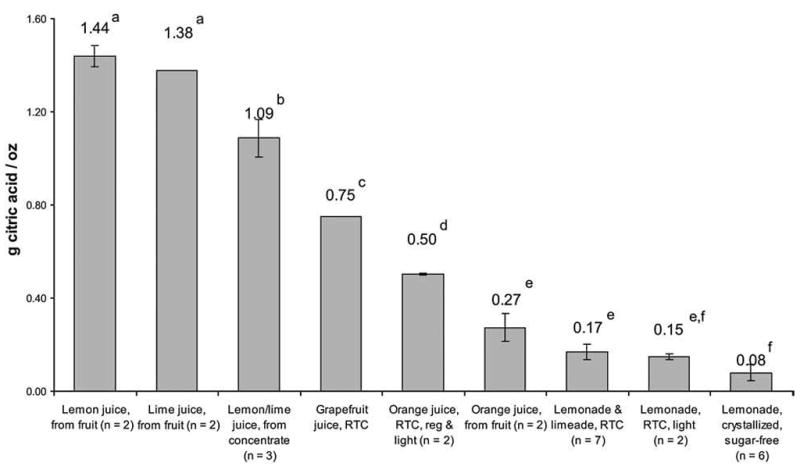
Comparison of citric acid concentrations (g/oz.) of juices and juice products by group. Bars, where shown, represent SD for each group. Values above each bar are the mean citric acid content (g/oz.) per group. Groups with same letters are similar (p >0.03). RTC, ready to consume; reg, regular.