Figure 4.
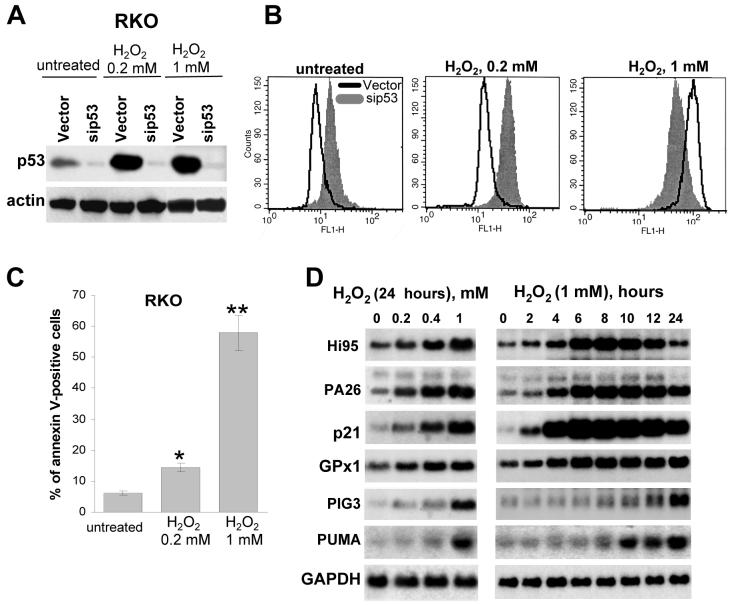
Antioxidant effect of p53 after mild stress and pro-oxidant effect of p53 after grave stress. (a) Expression of endogenous p53 in RKO cells infected with empty vector or vector bearing siRNA to p53 in control and H2O2-treated cells. (b) FACS analysis of DCF fluorescence levels in untreated and H2O2-treated (12 h) RKO and RKO/sip53 cells. (c) Apoptosis levels 24 h after treatment with 0.2 and 1mM of H2O2, as detected by FACS following Annexin V staining, *P = 0.08 and **P = 0.01 compared to untreated cell by the Student t test. (d,e) Dose-dependence (24 h after treatment) and kinetics (treatment with 1mM H2O2) of the induction of p53-responsive genes following H2O2 treatment (Northern analysis).

