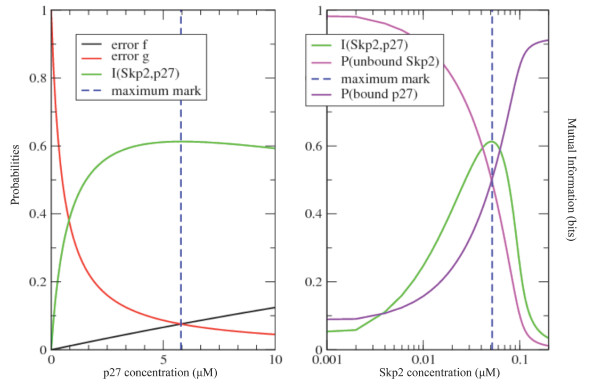
Figure 3.
Analysis of information exchange at Cks1 capacity. In both plots, the mutual information (green line) is shown. In the left panel, it is visualized for optimal [Cks1]* and [Skp2]* and varying [p27]. In the right panel, the same information is shown for optimal [Cks1]* and [p27]* and varying [Skp2]. In both plots, the blue striped line marks the concentrations of p27 (left panel) and of Skp2 (right panel) where the channel's capacity is obtained. In the left panel, the error probabilities f and g are added and are shown to be equal when the optimal value of mutual information is achieved. Both error probabilities intersect around f = g = 0.075 for [p27] ≈ 5.79 μM. In the right panel, the probabilities that Skp2 is not bound to Cks1 and p27 is bound to Cks1 were added.

