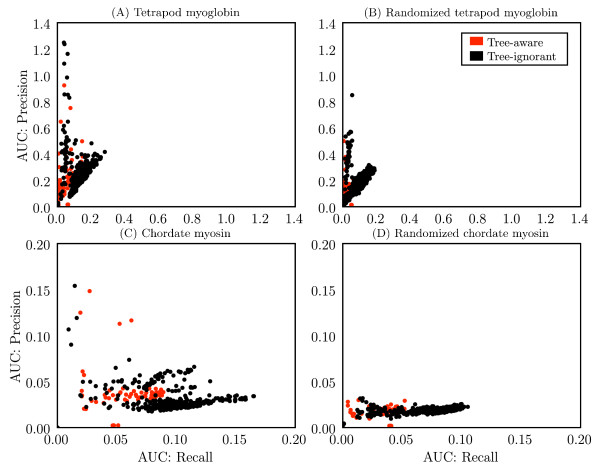
Figure 4.
Performance of method, alphabet combinations for detecting individual coevolving positions. Each combination of method and alphabet is represented as a single point, with coordinates defined by area under the curve (AUC) values for recall (y-axis) and precision (x-axis) for the (A) tetrapod myoglobin alignment, (B) randomized tetrapod myoglobin alignment, (C) chordate myosin rod alignment, and (D) randomized chordate myosin rod alignment. The computation of AUC values is described in Methods.

