
Fig. 1.
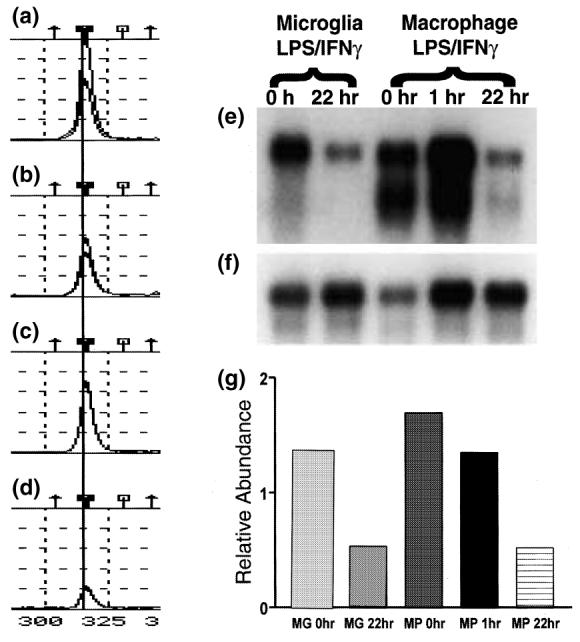
LPS/IFNγ decreases microglial (MG) and macrophage (MP) expression of TREM-2. (a–d) TOGA® profile for the product corresponding to TREM-2. The displayed TOGA® profile represents a small region of one of the 256 TOGA® electropherograms for each of the templates prepared from unstimulated cultured microglia (a), LPS/IFNγ-stimulated cultured microglia (b), unstimulated peritoneal macrophages (c) and LPS/IFNγ-stimulated peritoneal macrophages (d). The symbols on the top of (a–d) refer to the digital addresses (predicted positions) of known molecules. More details can be found in Sutcliffe et al. (2000). A line is drawn through the TOGA® PCR product corresponding to TREM-2. Peak amplitude corresponds to product abundance. (e) Northern blot with poly(A)+ RNA (2 μg/lane) prepared from unstimulated and LPS/IFNγ-stimulated cultured microglia and peritoneal macrophages was probed with a 32P-labeled TREM-2 cDNA clone. To determine the relative abundance of TREM-2 per sample, the same northern blot was re-probed with a RNA loading control, 32P-labeled cyclophilin cDNA clone (f), and the levels of TREM-2 relative to those of the loading control were quantified by densitometric analysis (g).