
Fig. 3.
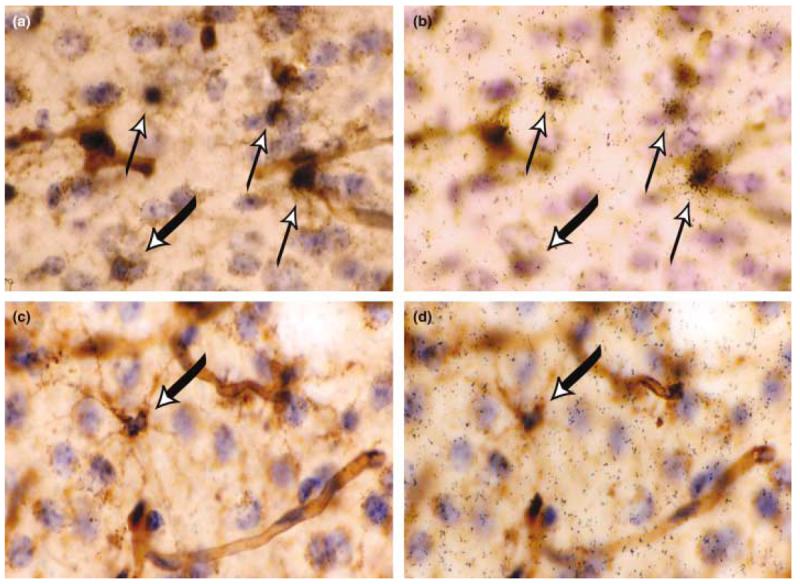
TREM-2 is expressed by lectin-positive cells in healthy adult murine brain. in situ hybridization analysis using a 35S-labeled antisense TREM-2 riboprobe (black grains) was performed on coronal sections from the CNS of untreated control mice (a and b) or from mice receiving intracerebral injections of LPS/IFNγ (c and d). In (a) and (c), the focal plane is at the level of lectin staining. In (b) and (d), the focal plane is at the level of the silver grains within the photographic emulsion. All nuclei are labeled with hematoxylin (in blue), and all myeloid cells and blood vessels are labeled with tomato lectin (in brown). Areas displayed are from the cingulate cortex. The thin upward pointing arrows in (a) and (b) indicate TREM-2-positive microglia and the thick downward pointing arrows in (a–d) indicate TREM-2-negative microglia. All cryosections were 25 μm in thickness. Magnification × 40.