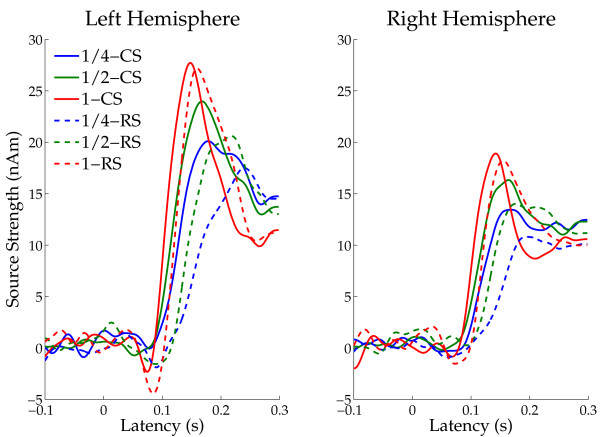
Figure 4.
Grand averaged source strength waveforms. Mean N1m source strengths (N = 14) in left and right hemispheres, respectively. Solid lines represent the constant sequencing condition (CS), and dotted lines represent the random sequencing condition (RS). Each colour represents a band-eliminated noise (BEN) condition (blue: 1 critical band, green: 1/2 critical band, red: 1/4 critical band).

