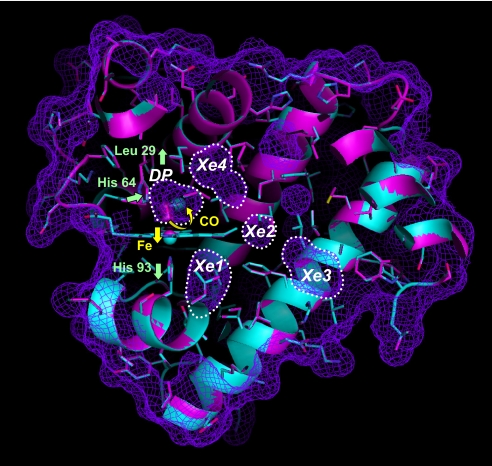
Fig. 1.
The crystal structures of MbCO before and after photodissociation of CO at 40 K are superimposed and shown in magenta and cyan, respectively. The molecular surface of MbCO and the surface of internal cavities are shown by the mesh in purple. The internal cavities (DP, Xe1, Xe2, Xe3, and Xe4) are also indicated by dotted lines. The electron densities of bound and photodissociated CO molecules in the DP are represented in magenta and cyan, respectively, by using a 2Fo − Fc map (contoured at 0.7 e/Å3). The movement of CO, heme iron atom, His-64, Leu-29, and His-93 after photodissociation is shown by yellow and green arrows.

