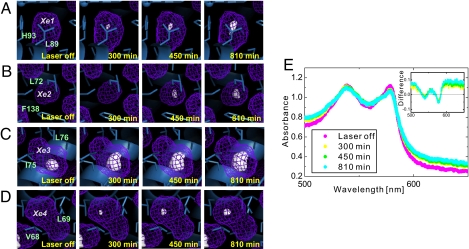
Fig. 2.
Photodissociation and migration of the CO molecule in Mb at 120 K. (A–D) Internal cavities and time-dependent evolution of the CO electron density in the Xe1 (A), Xe2 (B), Xe3 (C), and Xe4 (D) cavities at 120 K. The surfaces of the internal cavities are shown by the mesh in purple. The electron densities of the CO molecules in the cavities are presented by using the 2Fo − Fc map (contoured at 0.3 e/Å3). (E) Visible absorption spectra of MbCO crystal measured by microspectrophotometry at 120 K. (Inset) The differential absorption spectra against the initial MbCO spectrum.

