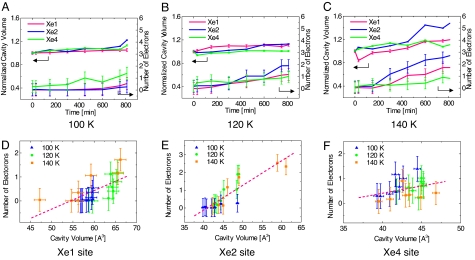
Fig. 3.
Temporal evolution and correlation of the occupancy of CO and the cavity volume. (A–C)The number of electrons integrated in each cavity and normalized volumes of the Xe1 (magenta), Xe2 (blue), and Xe4 (green) cavities at 100 K (A), 120 K (B), and 140 K (C) are shown. The number of electrons was integrated by using the CCP4 program suite (31). The volume of each cavity was calculated with the program CASTp (33) and normalized by the initial volume at time 0. (D–F) The correlation between the number of electrons and the volume of cavities Xe1 (D), Xe2 (E), and Xe4 (F) is shown.

