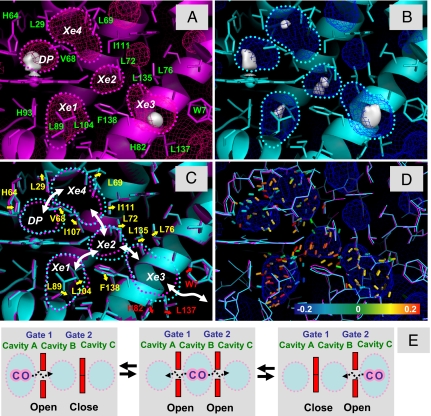
Fig. 4.
Correlated breathing motion of the internal cavities in Mb. (A and B) Structure of MbCO at 140 K before laser illumination (magenta) (A) and after 750-min laser illumination (cyan) (B). The electron densities of the CO molecules in the Xe cavities are presented by using the 2Fo − Fc map (contoured at 0.3 e/Å3). The surfaces of the internal cavities are shown by the mesh. The cavities are also outlined by dotted lines. (C) Amino acid residues lining the DP, Xe4, Xe2, Xe1, and Xe3 cavities. The color scheme is the same as that in A and B. The outlines of the cavities are also superimposed. The movements of amino acid residues between the cavities are shown by yellow arrows, and those between the Xe3 cavity and solvent area are shown by red arrows. The white arrows represent the ligand migration pathway between the cavities. (D) Strain tensors calculated by using 2 coordinates without laser illumination and after 750-min laser illumination. The strain tensors are shown with the maximum absolute eigenvalue, and the color of the segment shows the magnitude of the eigenvalue (blue, −0.20; green, 0, red, +0.20). The blue segments represent contraction, and the red segments show expansion. (E) Schematic drawing of the correlated ligand migration in a protein.

