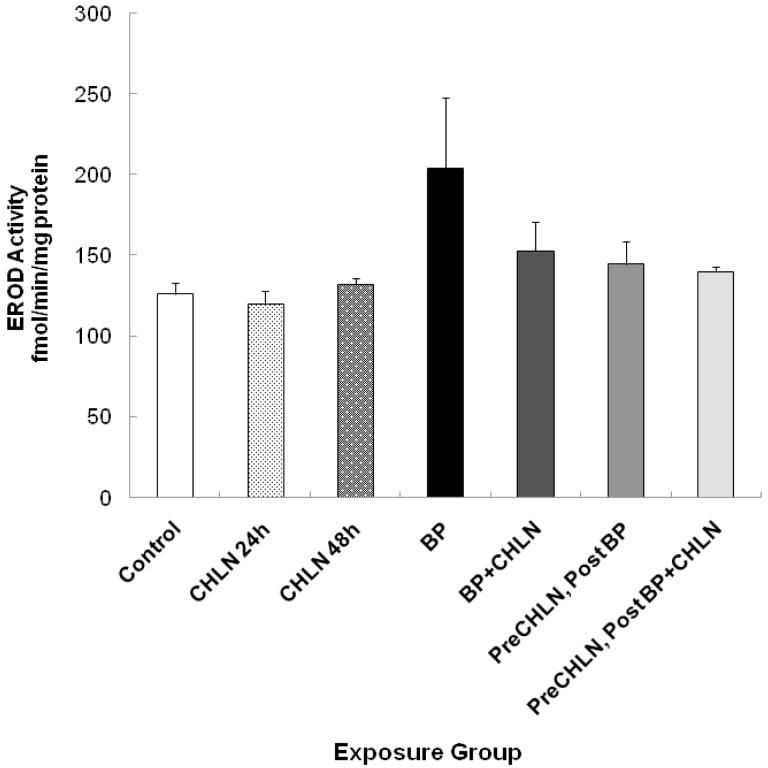
Figure 4.
EROD (combined CYP1A1 and CYP1B1) activity. Each bar represents mean ± range from 2 separate exposures with 2 replicates each, from which each replicate was assayed 6 times. Statistical significance for comparison between: the BP alone group vs. the preCHLN, postBP group, p=0.090; and the BP alone group vs. the preCHLN, postBP+CHLN group, p=0.066.

