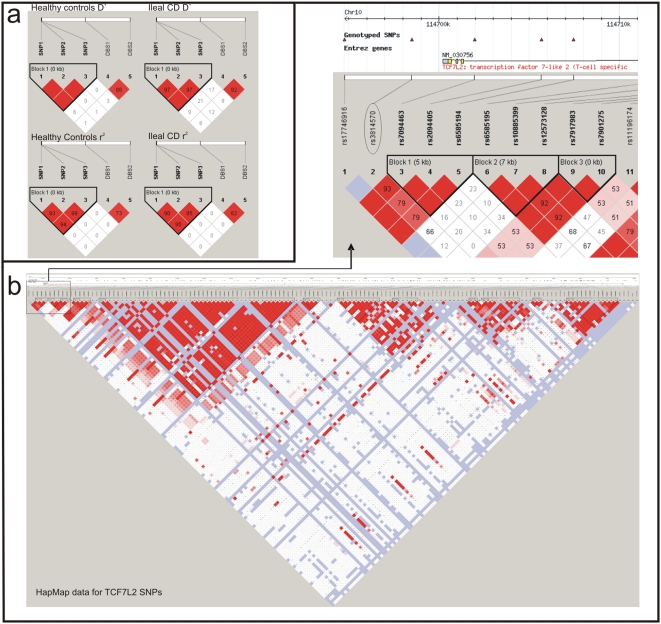
Figure 2. Distribution of haploblocks of TCF-4 (TCF7L2).
Both colour schemes (a and b) illustrate the linkage disequilibria. The variants are listed in the upper part of a and b, respectively. Haplotypes for TCF-4 (TCF7L2) rs3814570 (SNP1), rs10885394 (SNP2), rs10885395 (SNP3) and SNPs associated with diabetes in the Vienna cohort are shown in a. A missing number for D′ or r2 equals 1. Figure 2b: HapMap data based haplotype blocks and linkage disequilibria (LD) for TCF-4 (TCF7L2) polymorphisms. The intensity of red colouring in b is proportional to the extent of D′ or r 2 respectively and a missing number for each of them equals. The observed SNP in the putative promoter region is not part of any significant haplotype block.

