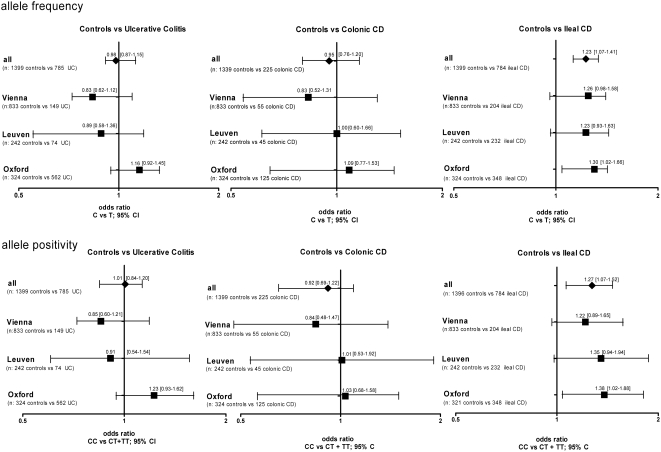
Figure 3. Differences in frequency distribution of rs3814570 in the different disease subgroups compared to healthy controls.
Odds ratios and confidence intervals for the different comparisons are shown. The frequency distribution of rs3814570 was analyzed in different cohorts and combined samples: odds ratios and 95% confidence interval for allele frequency (upper panel) and allele positivity (amount of all T- allele carriers, lower panel) are shown for patients with ulcerative colitis (UC) (left panel), Crohn's disease (CD) patients with solely colonic involvement (L2, middle panel) and finally patients classified as either L1 (solely ileal) or L3 (ileal and colonic involvement) (right panel) compared to healthy control individuals.

