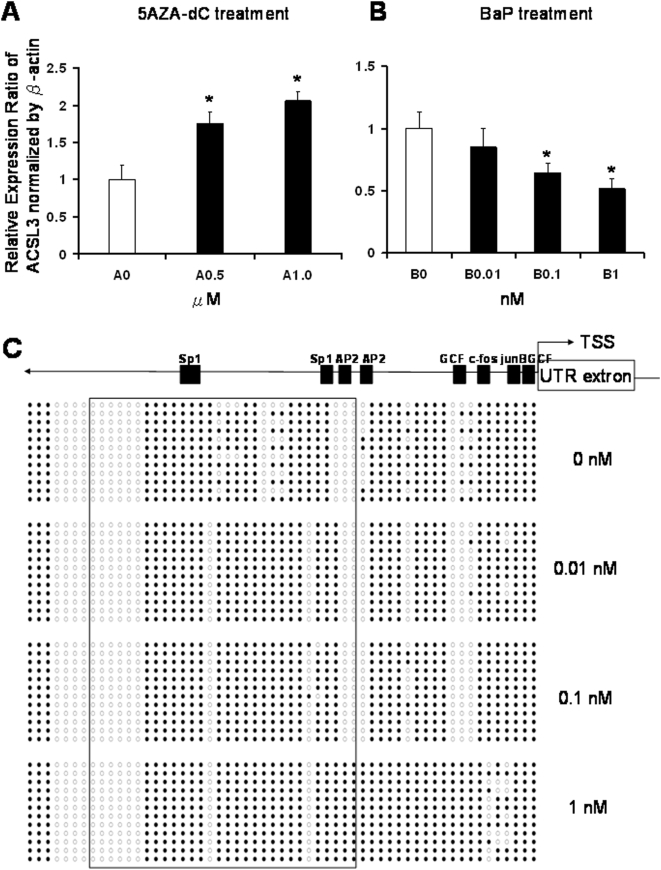
Figure 3. Real-time PCR analysis of gene expressions of ACSL3 in non-small cell lung cancer H1299 cell line in response to (A) 5-aza-deoxycytidine (5AZA-dC) and (B) benzo[a]pyrene (BaP) and bisulfite genomic sequencing analysis of ACSL3 promoter methylation status in response to BaP (C).
A: Cells were treated with 0.5 and 1.0 µM 5-AZA-dC with DMSO as control every 2 days for a total of 8 days. B: Cells were treated with 0.01, 0.1 and 1.0 nM BaP with DMSO as control every 2 days for a total of 4 days. RNA was isolated, reverse transcribed and underwent real-time PCR. The 2-ΔΔCt method was used to calculate the relative expression level of transcripts normalized to β-actin. *Statistically significant differences between exposed and control was accepted at p<0.05. C: Diagram represents methylation status of ACSL3 promoter of H1299 cells exposed to BaP assayed by bisulfite genomic sequencing. Cells were treated with 0.01, 0.1 and 1.0 nM BaP with DMSO as control every 2 days for a total of 4 days. Open circle: unmethylated CG; closed circle: methylated CG. Putative transcription factor binding sites such as Sp1, AP2, GCF, c-fos and junB are shown in scale with the particular CG sites on the promoter.

