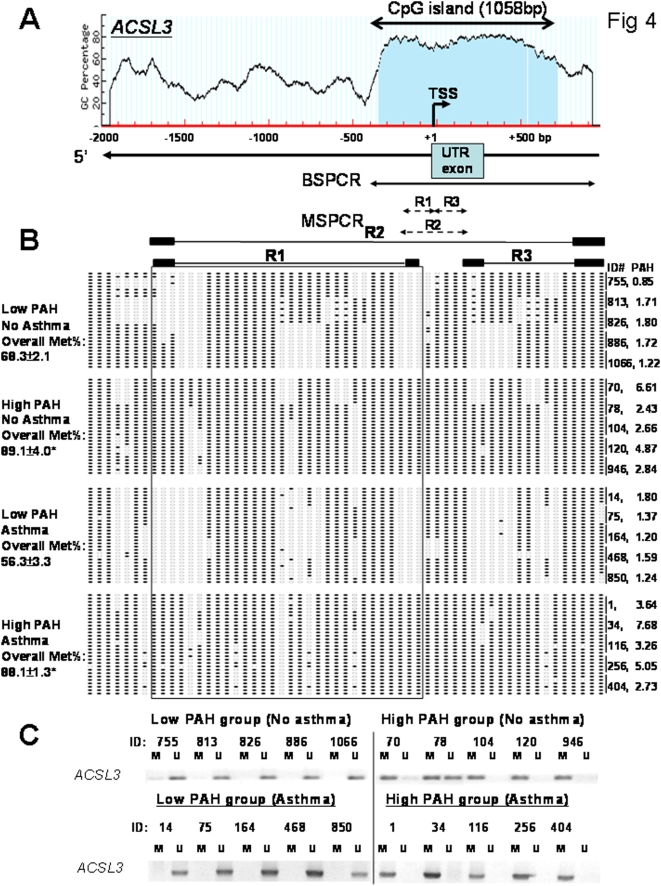
Figure 4. Methylation status of a region in the ACSL3 5′CGI analyzed by bisufite genomic sequencing and methylation specific PCR (MSPCR).
A) Schematic diagram of the CG content (%) in the 5′ flanking region of the ACSL3 gene. A CGI of 1058 bp was located at the 5′ end of ACSL3 including transcription start site (TSS), untranslated region (UTR) exon1 and intron 1. Individual CG sites are marked as red vertical lines in the genomic DNA sequence. The PCR-amplified regions were indicated by lines and methylation status of this region were determined by BSPCR and MSPCR. B) The diagram represents the methylation status of MSPCR-amplified regions (R1–R3) of 20 samples with high or low PAH exposure with or without asthma assayed by bisulfite genomic sequencing. 6 clones were sequenced from each sample. The PAH level of each sample is shown. Open circle: unmethylated CG; closed circle: methylated CG. MSPCR-primers were then specially designed on particular regions (R1–R3). Overall Met% of ACSL3 promoter is shown. Statistical difference was accepted at p<0.05* when compared with the group of low PAH without asthma. C) Representative results from MSPCR analyses on Region 1 (R1) of samples from the low and high PAH group. M: methylated; and U: unmethylated. The methylation status of ACSL3 5′-CGI of all samples was further analyzed by MS-PCR using the same sets of primers. Results are shown in Table 4 and Table 5. High PAH (≥ the cohort median of 2.3 ng/m3), Low PAH (<the cohort median).

